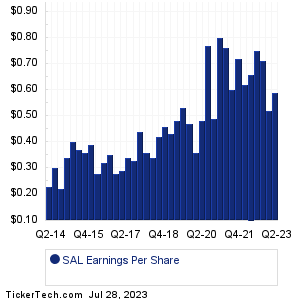
| Salisbury Bancorp Earnings History | |||||||||||||||||||||||||||||||||||||||||||||||||||||||||||||||||||||||||||||||||||||||||||||||||||||||||||||||||||||
|
|
|
| Salisbury Bancorp Earnings History | |||||||||||||||||||||||||||||||||||||||||||||||||||||||||||||||||||||||||||||||||||||||||||||||||||||||||||||||||||||
|
|
|
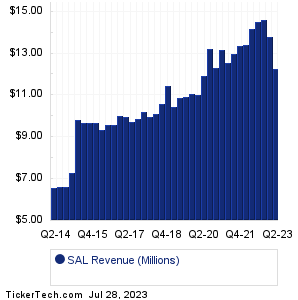
| SAL Revenue History | |||||||||||||||||||||||||||||||||||||||||||||||||||||||||||||||||||||||||||||||||||||||||||||||||||||||||||||||||||||
|
| SAL Current Stock Quote |
Get Dividend Alerts Get SEC Filing Alerts |
| SAL Stock Price Chart |
| Next Earnings Dates |
Next Earnings Date Calendar:Portland Gen Electric (POR): 7/28/2023 5:00 AMAon (AON): 7/28/2023 6:00 AM Centene (CNC): 7/28/2023 6:00 AM ArcBest (ARCB): 7/28/2023 6:00 AM Dime Community Bancshares (DCOM): 7/28/2023 6:00 AM iMedia Brands (IMBI): 7/28/2023 6:00 AM Avantor (AVTR): 7/28/2023 6:05 AM Carter's (CRI): 7/28/2023 6:05 AM Chevron (CVX): 7/28/2023 6:15 AM nVent Electric (NVT): 7/28/2023 6:30 AM More from the Next Earnings Dates Calendar Earnings History:Mid Penn Bancorp (MPB): 7/27/2023 6:03 PMHeritage Commerce (HTBK): 7/27/2023 5:52 PM Provident Bancorp (PVBC): 7/27/2023 5:40 PM First Savings Financial (FSFG): 7/27/2023 5:30 PM US Silica Holdings (SLCA): 7/27/2023 5:15 PM Lake Shore Bancorp (LSBK): 7/27/2023 5:09 PM Apartment Income REIT (AIRC): 7/27/2023 5:08 PM Ovintiv (OVV): 7/27/2023 5:05 PM TFS Financial (TFSL): 7/27/2023 5:01 PM Minerals Technologies (MTX): 7/27/2023 5:01 PM More from the Earnings History archive |
| Featured Articles |
| Earnings Peers |
| Salisbury Bancorp (SAL) is categorized under the Financials sector; to help you further research past earnings across stocks, below are some other companies in the same sector:
SAMG Past Earnings SASR Past Earnings SBCF Past Earnings SBFG Past Earnings SBRA Past Earnings SBSI Past Earnings SBT Past Earnings SC Past Earnings SCHW Past Earnings SCU Past Earnings |
Click the button below for your complimentary copy of Your Early Retirement Portfolio: Dividends Up to 7.8%—Every Month—Forever.
You'll discover the details on 4 stocks and funds that pay you massive dividends as high as 7.8%.