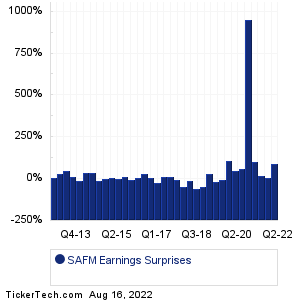
| SAFM Earnings Surprises | ||||||||||||||||||||||||||||||||||||||||||||||||||||||||||||||||||||||||||||||||||||||||||||||||||||||||||||||||||||||||||||||||||||||||||||||||
|
|
|
| SAFM Earnings Surprises | ||||||||||||||||||||||||||||||||||||||||||||||||||||||||||||||||||||||||||||||||||||||||||||||||||||||||||||||||||||||||||||||||||||||||||||||||
|
|
|
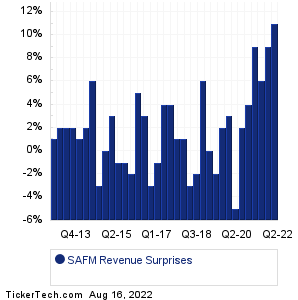
| SAFM Revenue Surprises | ||||||||||||||||||||||||||||||||||||||||||||||||||||||||||||||||||||||||||||||||||||||||||||||||||||||||||||||||||||||||||||||||||||||||||||||||
|
| SAFM Current Stock Quote |
Get Dividend Alerts Get SEC Filing Alerts |
| SAFM Stock Price Chart |
| Next Earnings Dates |
Next Earnings Date Calendar:Home Depot (HD): 8/16/2022 6:00 AMGreenlane Holdings (GNLN): 8/16/2022 6:00 AM Premier (PINC): 8/16/2022 6:30 AM Walmart (WMT): 8/16/2022 7:00 AM Janus Intl Gr (JBI): 8/16/2022 7:00 AM Orgenesis (ORGS): 8/16/2022 7:00 AM Milestone Scientific (MLSS): 8/16/2022 7:00 AM Bio-Path Holdings (BPTH): 8/16/2022 7:00 AM Lumentum Holdings (LITE): 8/16/2022 7:30 AM Sypris Solutions (SYPR): 8/16/2022 7:45 AM More from the Next Earnings Dates Calendar Earnings History:Network-1 Technologies (NTIP): 8/15/2022 7:00 PMTSR (TSRI): 8/15/2022 5:00 PM Reviva Pharmaceuticals (RVPH): 8/15/2022 5:00 PM Comstock Holding Co (CHCI): 8/15/2022 5:00 PM Digital Ally (DGLY): 8/15/2022 5:00 PM Flexible Solutions (FSI): 8/15/2022 After close Verb Tech (VERB): 8/15/2022 After close Advanced Emissions Solns (ADES): 8/15/2022 After close Lucid Diagnostics (LUCD): 8/15/2022 After close Servotronics (SVT): 8/15/2022 After close More from the Earnings History archive |
| Earnings Peers |
| Sanderson Farms (SAFM) is categorized under the Consumer sector; to help you further research past earnings across stocks, below are some other companies in the same sector:
SAM Historical Earnings SANW Historical Earnings SGC Historical Earnings SHOO Historical Earnings SJM Historical Earnings SKX Historical Earnings SMP Historical Earnings SMPL Historical Earnings SNAX Historical Earnings SNPO Historical Earnings |
Recommended: Institutional Holders of BOXC, NIQ YTD Return, ZOLT Videos.