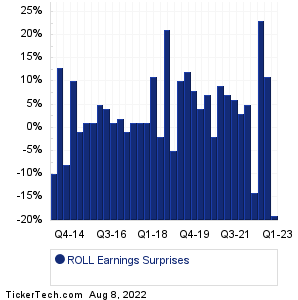
| ROLL Earnings Surprises | ||||||||||||||||||||||||||||||||||||||||||||||||||||||||||||||||||||||||||||||||||||||||||||||||||||||||||||||||||||||||||||||||||||||||||||
|
|
|
| ROLL Earnings Surprises | ||||||||||||||||||||||||||||||||||||||||||||||||||||||||||||||||||||||||||||||||||||||||||||||||||||||||||||||||||||||||||||||||||||||||||||
|
|
|
| ROLL Revenue Surprises | ||||||||||||||||||||||||||||||||||||||||||||||||||||||||||||||||||||||||||||||||||||||||||||||||||||||||||||||||||||||||||||||||||||||||||||
|
| ROLL Current Stock Quote |
Get Dividend Alerts Get SEC Filing Alerts |
| ROLL Stock Price Chart |
| Next Earnings Dates |
Next Earnings Date Calendar:Viatris (VTRS): 8/8/2022 6:00 AMHawaiian Electric Indus (HE): 8/8/2022 6:00 AM Clovis Oncology (CLVS): 8/8/2022 6:00 AM Elanco Animal Health (ELAN): 8/8/2022 6:30 AM HF Sinclair (DINO): 8/8/2022 6:30 AM Energizer Holdings (ENR): 8/8/2022 6:30 AM Information Services (III): 8/8/2022 6:30 AM Blue Apron Holdings (APRN): 8/8/2022 6:30 AM ANI Pharmaceuticals (ANIP): 8/8/2022 6:50 AM Treehouse Foods (THS): 8/8/2022 6:55 AM More from the Next Earnings Dates Calendar Earnings History:Sono-Tek (SOTK): 8/7/2022 9:10 AMBerkshire Hathaway Inc. Common Stock (BRK-A): 8/6/2022 7:00 AM Berkshire Hathaway Inc. New Common Stock (BRK-B): 8/6/2022 7:00 AM Chicago Rivet & Machine (CVR): 8/5/2022 After close Salarius Pharmaceuticals (SLRX): 8/5/2022 After close Saga Communications (SGA): 8/5/2022 9:00 AM Patriot National Bancorp (PNBK): 8/5/2022 8:30 AM Nathan's Famous (NATH): 8/5/2022 8:30 AM Investors Title (ITIC): 8/5/2022 8:30 AM Liberty Braves Group (BATRA): 8/5/2022 8:15 AM More from the Earnings History archive |
| Earnings Peers |
| RBC Bearings (ROLL) is categorized under the Industrials sector; to help you further research past earnings across stocks, below are some other companies in the same sector:
RRD Historical Earnings RRX Historical Earnings RSG Historical Earnings RTX Historical Earnings RUN Historical Earnings RXN Historical Earnings SAIA Historical Earnings SANM Historical Earnings SAVE Historical Earnings SB Historical Earnings |