RLGY Earnings Surprises image   This RLGY earnings surprises page last updated 5/2/2022
RLGY Earnings Surprises Chart
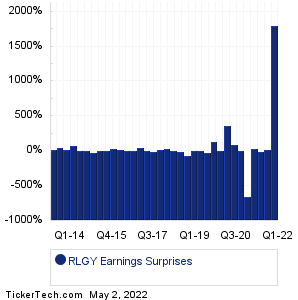
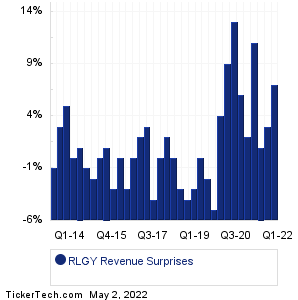
Data adjusted for RLGY split history

PeriodExpectedActualSurprise
Q1 2022 -0.01 -0.19 -0.18 (+1800%)
Q4 2021 0.32 0.38 +0.06 (+19%)
Q3 2021 1.13 0.99 -0.14 (-12%)
Q2 2021 1.07 1.33 +0.26 (+24%)
Q1 2021 -0.06 0.34 +0.40 (-667%)
Q4 2020 0.71 0.67 -0.04 (-6%)
Q3 2020 0.72 1.38 +0.66 (+92%)
Q2 2020 0.10 0.46 +0.36 (+360%)
Q1 2020 -0.58 -0.55 +0.03 (-5%)
Q4 2019 0.09 0.20 +0.11 (+122%)
Q3 2019 0.86 0.65 -0.21 (-24%)
Q2 2019 0.82 0.83 +0.01 (+1%)
Q1 2019 -0.65 -0.67 -0.02 (+3%)
Q4 2018 0.12 0.04 -0.08 (-67%)
Q3 2018 0.94 0.84 -0.10 (-11%)
Q2 2018 0.98 1.00 +0.02 (+2%)
Q1 2018 -0.31 -0.38 -0.07 (+23%)
Q4 2017 0.23 0.26 +0.03 (+13%)
Q3 2017 0.81 0.70 -0.11 (-14%)
Q2 2017 0.74 0.77 +0.03 (+4%)
Q4 2016 0.20 0.28 +0.08 (+40%)
Q3 2016 0.76 0.74 -0.02 (-3%)
Q2 2016 0.77 0.74 -0.03 (-4%)
Q1 2016 -0.11 -0.12 -0.01 (+9%)
Q4 2015 0.23 0.28 +0.05 (+22%)
Q3 2015 0.75 0.76 +0.01 (+1%)
Q2 2015 0.69 0.66 -0.03 (-4%)
Q4 2014 0.20 0.14 -0.06 (-30%)
Q3 2014 0.65 0.68 +0.03 (+5%)
Q2 2014 0.58 0.59 +0.01 (+2%)
Q1 2014 -0.19 -0.32 -0.13 (+68%)
Q3 2013 0.85 1.02 +0.17 (+20%)
Q2 2013 0.72 1.05 +0.33 (+46%)
Q1 2013 -0.43 -0.52 -0.09 (+21%)
RLGY Revenue Surprises Chart
PeriodExpectedActualSurprise
Q1 2022 1.53B 1.64B +105.00M (+7%)
Q4 2021 1.92B 1.97B +54.00M (+3%)
Q3 2021 2.16B 2.19B +26.00M (+1%)
Q2 2021 2.05B 2.28B +226.00M (+11%)
Q1 2021 1.51B 1.55B +37.00M (+3%)
Q4 2020 1.78B 1.89B +109.00M (+6%)
Q3 2020 1.64B 1.86B +217.00M (+13%)
Q2 2020 1.11B 1.21B +97.00M (+9%)
Q1 2020 1.07B 1.12B +46.00M (+5%)
Q4 2019 1.40B 1.33B -70.00M (-5%)
Q3 2019 1.67B 1.63B -41.00M (-2%)
Q2 2019 1.73B 1.74B +5.00M (+1%)
Q1 2019 1.15B 1.11B -36.00M (-3%)
Q4 2018 1.41B 1.35B -56.00M (-4%)
Q3 2018 1.72B 1.68B -44.00M (-2%)
Q2 2018 1.82B 1.82B NA (0%)
Q1 2018 1.21B 1.23B +19.00M (+2%)
Q4 2017 1.45B 1.44B -6.00M (-1%)
Q3 2017 1.75B 1.67B -76.00M (-5%)
Q2 2017 1.74B 1.79B +53.00M (+3%)
Q4 2016 1.34B 1.37B +30.00M (+2%)
Q3 2016 1.64B 1.64B +4.00M (0%)
Q2 2016 1.71B 1.66B -48.00M (-3%)
Q1 2016 1.13B 1.13B +4.00M (0%)
Q4 2015 1.37B 1.32B -45.00M (-4%)
Q3 2015 1.65B 1.67B +18.00M (+1%)
Q2 2015 1.65B 1.65B +1.00M (0%)
Q4 2014 1.30B 1.28B -22.00M (-2%)
Q3 2014 1.52B 1.50B -20.00M (-1%)
Q2 2014 1.49B 1.51B +20.00M (+1%)
Q1 2014 1.01B 1.01B NA (0%)
Q3 2013 1.48B 1.55B +70.00M (+5%)
Q2 2013 1.49B 1.53B +40.00M (+3%)
Q1 2013 964.53M 957.00M -7.53M (-1%)
Quotes delayed 20 minutes

Email EnvelopeFree RLGY Email Alerts:
Get Dividend Alerts
Get SEC Filing Alerts
10 Most Oversold S&P 500 Stocks
10 Most Overbought S&P 500 Stocks
10 ETFs With Stocks Insiders Are Buying
10 ETFs With Most Upside To Targets
The DividendRank Top 25
Warren Buffett Dividend Stocks
10 Cheap Dividend Stocks Under $10
10 Top DividendRank'ed Energy Stocks
The 10 Highest Yielding Preferred Stocks
The 15 Most Active S&P Call & Put Options

Next Earnings Date Calendar:

Loews (L): 5/2/2022 6:00 AM
JELD-WEN Holding (JELD): 5/2/2022 6:00 AM
EnPro Industries (NPO): 5/2/2022 6:30 AM
Timken (TKR): 5/2/2022 6:51 AM
Global Payments (GPN): 5/2/2022 6:55 AM
Moody's (MCO): 5/2/2022 7:00 AM
WEC Energy Group (WEC): 5/2/2022 7:00 AM
Affiliated Managers Group (AMG): 5/2/2022 7:00 AM
Discovery (DISCA): 5/2/2022 7:00 AM
Axsome Therapeutics (AXSM): 5/2/2022 7:00 AM

More from the Next Earnings Dates Calendar

Earnings History:

Berkshire Hathaway Inc. Common Stock (BRK-A): 4/30/2022 7:00 AM
Berkshire Hathaway Inc. New Common Stock (BRK-B): 4/30/2022 7:00 AM
Prudential Bancorp (PBIP): 4/29/2022 After close
Cogent Comms Hldgs (CCOI): 4/29/2022 After close
IF Bancorp (IROQ): 4/29/2022 After close
Kaspien Holdings (KSPN): 4/29/2022 After close
Zosano Pharma (ZSAN): 4/29/2022 After close
Emclaire Financial (EMCF): 4/29/2022 After close
Hawthorn Bancshares (HWBK): 4/29/2022 After close
FNCB Bancorp (FNCB): 4/29/2022 After close

More from the Earnings History archive
Realogy Holdings (RLGY) is categorized under the Financials sector; to help you further research past earnings across stocks, below are some other companies in the same sector:

RLI Past Earnings
RLJ Past Earnings
RM Past Earnings
RMAX Past Earnings
RMBI Past Earnings
RNDB Past Earnings
RNR Past Earnings
RNST Past Earnings
ROIC Past Earnings
ROOT Past Earnings
On this page we presented the RLGY earnings surprises information for Realogy Holdings, comparing the expected earnings versus the actual earnings quarter by quarter, with the resulting positive or negative percentage surprise. Any self directed investor doing their due diligence on RLGY (or any other given stock) can benefit from researching all of the Realogy Holdings past earnings going backwards in time, including how often the company beat or missed the market's expectations. To help you with this Realogy Holdings earnings surprise research, on this page we presented each quarter's resulting numbers for easy comparison. Studying these numbers can help an investor by providing important context with which to think about RLGY's next earnings report. In your continued research on Realogy Holdings we hope you will be sure to check out the further links included for revenue and earnings history as well as next earnings dates for RLGY. Thanks for visiting, and the next time you need to research RLGY earnings surprises or those of another stock, we hope you'll think of our site as your go-to earnings surprises research resource of choice.

Recommended: AEYE Videos, PEGI shares outstanding history, HCAP shares outstanding history.


RLGY Earnings Surprises | www.NextEarningsDate.com | Copyright © 2020 - 2022, All Rights Reserved

Nothing in NextEarningsDate.com is intended to be investment advice, nor does it represent the opinion of, counsel from, or recommendations by BNK Invest Inc. or any of its affiliates, subsidiaries or partners. None of the information contained herein constitutes a recommendation that any particular security, portfolio, transaction, or investment strategy is suitable for any specific person. All viewers agree that under no circumstances will BNK Invest, Inc,. its subsidiaries, partners, officers, employees, affiliates, or agents be held liable for any loss or damage caused by your reliance on information obtained. By visiting, using or viewing this site, you agree to the following Full Disclaimer & Terms of Use and Privacy Policy. Video widget and market videos powered by Market News Video. Quote and option data delayed at least 15 minutes; stock quote data powered by Ticker Technologies, and Mergent.