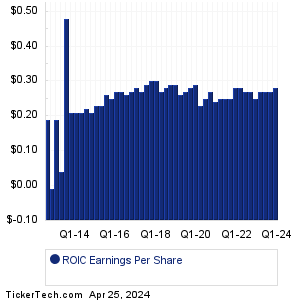
| Retail Opportunity Earnings History | ||||||||||||||||||||||||||||||||||||||||||||||||||||||||||||||||||||||||||||||||||||||||||||||||||||||||||||||||||||||||||||||||||||
|
|
|
| Retail Opportunity Earnings History | ||||||||||||||||||||||||||||||||||||||||||||||||||||||||||||||||||||||||||||||||||||||||||||||||||||||||||||||||||||||||||||||||||||
|
|
|
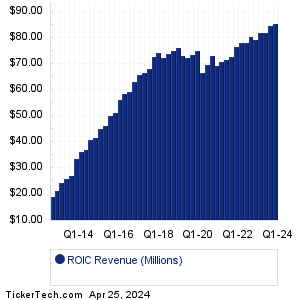
| ROIC Revenue History | ||||||||||||||||||||||||||||||||||||||||||||||||||||||||||||||||||||||||||||||||||||||||||||||||||||||||||||||||||||||||||||||||||||
|
| ROIC Current Stock Quote |
Get Dividend Alerts Get SEC Filing Alerts |
| ROIC Stock Price Chart |
| Next Earnings Dates |
Next Earnings Date Calendar:Linde (LIN): 4/27/2023 6:00 AMTractor Supply (TSCO): 4/27/2023 6:00 AM West Pharmaceutical Servs (WST): 4/27/2023 6:00 AM Willis Towers Watson (WTW): 4/27/2023 6:00 AM LKQ (LKQ): 4/27/2023 6:00 AM ExlService Holdings (EXLS): 4/27/2023 6:00 AM FirstCash Hldgs (FCFS): 4/27/2023 6:00 AM Tri Pointe Homes (TPH): 4/27/2023 6:00 AM Pacific Premier Bancorp (PPBI): 4/27/2023 6:00 AM Gentherm (THRM): 4/27/2023 6:00 AM More from the Next Earnings Dates Calendar Earnings History:Waste Management (WM): 4/26/2023 7:00 PMFirst Bancshares (FBMS): 4/26/2023 6:00 PM Patterson-UTI Energy (PTEN): 4/26/2023 6:00 PM Bel Fuse (BELFA): 4/26/2023 5:30 PM Bel Fuse (BELFB): 4/26/2023 5:30 PM First Interstate BancSys (FIBK): 4/26/2023 5:11 PM Spirit Airlines (SAVE): 4/26/2023 5:07 PM Kilroy Realty (KRC): 4/26/2023 5:06 PM Oceaneering International (OII): 4/26/2023 5:01 PM NewMarket (NEU): 4/26/2023 5:01 PM More from the Earnings History archive |
| Featured Articles |
| Earnings Peers |
| Retail Opportunity (ROIC) is categorized under the Financials sector; to help you further research past earnings across stocks, below are some other companies in the same sector:
ROOT Past Earnings RPAI Past Earnings RPT Past Earnings RRBI Past Earnings RVI Past Earnings RVSB Past Earnings RWT Past Earnings RYAN Past Earnings RYN Past Earnings SAFE Past Earnings |
Recommended: ETFs Holding EXR, VGFC YTD Return, HTBK shares outstanding history.