RCII Earnings Surprises image   This RCII earnings surprises page last updated 2/24/2023
RCII Earnings Surprises Chart
PeriodExpectedActualSurprise
Q4 2022 0.74 0.86 +0.12 (+16%)
Q3 2022 0.89 0.94 +0.05 (+6%)
Q2 2022 1.01 1.15 +0.14 (+14%)
Q1 2022 0.81 0.74 -0.07 (-9%)
Q4 2021 1.61 1.08 -0.53 (-33%)
Q3 2021 1.50 1.52 +0.02 (+1%)
Q2 2021 1.35 1.63 +0.28 (+21%)
Q1 2021 1.11 1.32 +0.21 (+19%)
Q4 2020 1.02 1.03 +0.01 (+1%)
Q3 2020 0.96 1.04 +0.08 (+8%)
Q2 2020 0.60 0.80 +0.20 (+33%)
Q1 2020 0.59 0.67 +0.08 (+14%)
Q4 2019 0.57 0.58 +0.01 (+2%)
Q3 2019 0.50 0.47 -0.03 (-6%)
Q2 2019 0.55 0.60 +0.05 (+9%)
Q1 2019 0.32 0.59 +0.27 (+84%)
Q4 2018 0.20 0.35 +0.15 (+75%)
Q3 2018 0.23 0.32 +0.09 (+39%)
Q2 2018 0.24 0.47 +0.23 (+96%)
Q1 2018 0.08 -0.08 -0.16 (-200%)
Q4 2017 -0.07 -0.41 -0.34 (+486%)
Q3 2017 -0.04 -0.15 -0.11 (+275%)
Q2 2017 0.08 -0.01 -0.09 (-112%)
Q1 2017 -0.01 0.04 +0.05 (-500%)
Q4 2016 -0.19 -0.23 -0.04 (+21%)
Q3 2016 0.39 0.11 -0.28 (-72%)
Q2 2016 0.49 0.41 -0.08 (-16%)
Q1 2016 0.40 0.48 +0.08 (+20%)
Q4 2015 0.52 0.54 +0.02 (+4%)
Q3 2015 0.45 0.47 +0.02 (+4%)
Q2 2015 0.49 0.50 +0.01 (+2%)
Q1 2015 0.50 0.52 +0.02 (+4%)
Q4 2014 0.63 0.50 -0.13 (-21%)
Q3 2014 0.47 0.48 +0.01 (+2%)
Q2 2014 0.48 0.33 -0.15 (-31%)
Q1 2014 0.56 0.57 +0.01 (+2%)
Q4 2013 0.76 0.25 -0.51 (-67%)
Q3 2013 0.62 0.51 -0.11 (-18%)
Q2 2013 0.75 0.76 +0.01 (+1%)
Q1 2013 0.88 0.86 -0.02 (-2%)
Q4 2012 0.83 0.81 -0.02 (-2%)
Q3 2012 0.68 0.60 -0.08 (-12%)
Q2 2012 0.71 0.74 +0.03 (+4%)
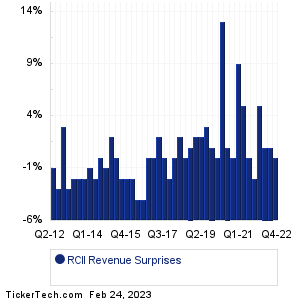
RCII Revenue Surprises Chart
PeriodExpectedActualSurprise
Q4 2022 990.42M 990.50M +80000 (0%)
Q3 2022 1.01B 1.02B +14.00M (+1%)
Q2 2022 1.06B 1.07B +11.00M (+1%)
Q1 2022 1.11B 1.16B +50.00M (+5%)
Q4 2021 1.20B 1.17B -29.00M (-2%)
Q3 2021 1.18B 1.18B +1.00M (0%)
Q2 2021 1.14B 1.19B +54.00M (+4%)
Q1 2021 953.23M 1.04B +83.77M (-100%)
Q4 2020 712.94M 716.49M +3.55M (0%)
Q3 2020 702.76M 712.01M +9.26M (+1%)
Q2 2020 604.99M 683.75M +78.76M (+13%)
Q1 2020 702.82M 701.94M -0.88M (-0%)
Q4 2019 658.14M 667.86M +9.72M (+1%)
Q3 2019 630.86M 649.37M +18.51M (+3%)
Q2 2019 641.94M 655.92M +13.98M (+2%)
Q1 2019 680.76M 696.69M +15.93M (+2%)
Q4 2018 656.78M 661.75M +4.97M (+1%)
Q3 2018 642.60M 644.94M +2.34M (0%)
Q2 2018 644.12M 655.73M +11.61M (+2%)
Q1 2018 699.84M 698.04M -1.80M (-0%)
Q4 2017 654.71M 638.95M -15.76M (-2%)
Q3 2017 646.60M 643.97M -2.63M (-0%)
Q2 2017 666.68M 677.63M +10.96M (+2%)
Q1 2017 744.99M 741.99M -3.00M (-0%)
Q4 2016 686.47M 684.10M -2.37M (-0%)
Q3 2016 723.54M 693.88M -29.66M (-4%)
Q2 2016 782.12M 749.62M -32.50M (-4%)
Q1 2016 850.92M 835.65M -15.27M (-2%)
Q4 2015 806.89M 793.83M -13.06M (-2%)
Q3 2015 804.03M 791.61M -12.43M (-2%)
Q2 2015 813.41M 815.34M +1.93M (0%)
Q1 2015 863.33M 877.64M +14.31M (+2%)
Q4 2014 804.83M 797.12M -7.71M (-1%)
Q3 2014 773.32M 769.50M -3.82M (-0%)
Q2 2014 786.40M 773.20M -13.20M (-2%)
Q1 2014 840.31M 833.70M -6.61M (-1%)
Q4 2013 787.95M 769.60M -18.35M (-2%)
Q3 2013 773.56M 754.80M -18.76M (-2%)
Q2 2013 779.38M 760.50M -18.88M (-2%)
Q1 2013 845.71M 819.30M -26.41M (-3%)
Q4 2012 737.50M 758.40M +20.90M (+3%)
Q3 2012 759.77M 739.30M -20.47M (-3%)
Q2 2012 753.94M 749.70M -4.24M (-1%)
Quotes delayed 20 minutes

Email EnvelopeFree RCII Email Alerts:
Get Dividend Alerts
Get SEC Filing Alerts
10 Most Oversold S&P 500 Stocks
10 Most Overbought S&P 500 Stocks
10 ETFs With Stocks Insiders Are Buying
10 ETFs With Most Upside To Targets
The DividendRank Top 25
Warren Buffett Dividend Stocks
10 Cheap Dividend Stocks Under $10
10 Top DividendRank'ed Energy Stocks
The 10 Highest Yielding Preferred Stocks
The 15 Most Active S&P Call & Put Options

Next Earnings Date Calendar:

Evergy (EVRG): 2/24/2023 6:00 AM
Lamar Advertising (LAMR): 2/24/2023 6:00 AM
Chart Industries (GTLS): 2/24/2023 6:00 AM
PNM Resources (PNM): 2/24/2023 6:00 AM
Northwest Natural Holding (NWN): 2/24/2023 6:00 AM
US Silica Holdings (SLCA): 2/24/2023 6:00 AM
ACM Research (ACMR): 2/24/2023 6:00 AM
Carter's (CRI): 2/24/2023 6:05 AM
Gray Television (GTN): 2/24/2023 6:25 AM
HF Sinclair (DINO): 2/24/2023 6:30 AM

More from the Next Earnings Dates Calendar

Earnings History:

Oceaneering International (OII): 2/23/2023 5:01 PM
Granite Point Mortgage (GPMT): 2/23/2023 After close
MasTec (MTZ): 2/23/2023 After close
Diamond Hill Inv Gr (DHIL): 2/23/2023 After close
Ellington Financial (EFC): 2/23/2023 After close
Apollo Medical Holdings (AMEH): 2/23/2023 After close
Shattuck Labs (STTK): 2/23/2023 After close
Olympic Steel (ZEUS): 2/23/2023 After close
Kaman (KAMN): 2/23/2023 After close
Quaker Chemical (KWR): 2/23/2023 After close

More from the Earnings History archive
Rent-A-Center (RCII) is categorized under the Services sector; to help you further research past earnings across stocks, below are some other companies in the same sector:

RDI Historical Earnings
REAL Historical Earnings
RELY Historical Earnings
REZI Historical Earnings
RGS Historical Earnings
RH Historical Earnings
RICK Historical Earnings
RIVN Historical Earnings
ROKU Historical Earnings
ROL Historical Earnings
On this page we presented the RCII earnings surprises information for Rent-A-Center, comparing the expected earnings versus the actual earnings quarter by quarter, with the resulting positive or negative percentage surprise. Any self directed investor doing their due diligence on RCII (or any other given stock) can benefit from researching all of the Rent-A-Center past earnings going backwards in time, including how often the company beat or missed the market's expectations. To help you with this Rent-A-Center earnings surprise research, on this page we presented each quarter's resulting numbers for easy comparison. Studying these numbers can help an investor by providing important context with which to think about RCII's next earnings report. In your continued research on Rent-A-Center we hope you will be sure to check out the further links included for revenue and earnings history as well as next earnings dates for RCII. Thanks for visiting, and the next time you need to research RCII earnings surprises or those of another stock, we hope you'll think of our site as your go-to earnings surprises research resource of choice.

Recommended: PAYO shares outstanding history, Top Ten Hedge Funds Holding FFEB, PFFV Average Annual Return.


RCII Earnings Surprises | www.NextEarningsDate.com | Copyright © 2020 - 2023, All Rights Reserved

Nothing in NextEarningsDate.com is intended to be investment advice, nor does it represent the opinion of, counsel from, or recommendations by BNK Invest Inc. or any of its affiliates, subsidiaries or partners. None of the information contained herein constitutes a recommendation that any particular security, portfolio, transaction, or investment strategy is suitable for any specific person. All viewers agree that under no circumstances will BNK Invest, Inc,. its subsidiaries, partners, officers, employees, affiliates, or agents be held liable for any loss or damage caused by your reliance on information obtained. By visiting, using or viewing this site, you agree to the following Full Disclaimer & Terms of Use and Privacy Policy. Video widget and market videos powered by Market News Video. Quote and option data delayed at least 15 minutes; stock quote data powered by Ticker Technologies, and Mergent.