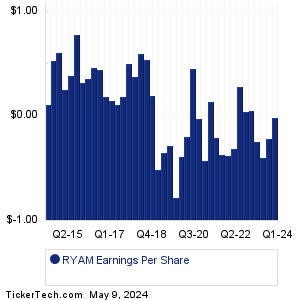
| Rayonier Adv Materials Earnings History | |||||||||||||||||||||||||||||||||||||||||||||||||||||||||||||||||||||||||||||||||||||||||||||||||||||||||||||||
|
|
|
| Rayonier Adv Materials Earnings History | |||||||||||||||||||||||||||||||||||||||||||||||||||||||||||||||||||||||||||||||||||||||||||||||||||||||||||||||
|
|
|
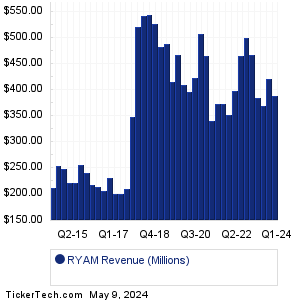
| RYAM Revenue History | |||||||||||||||||||||||||||||||||||||||||||||||||||||||||||||||||||||||||||||||||||||||||||||||||||||||||||||||
|
| RYAM Current Stock Quote |
Get Dividend Alerts Get SEC Filing Alerts |
| RYAM Stock Price Chart |
| Next Earnings Dates |
Next Earnings Date Calendar:Revvity (PKI): 5/11/2023 6:00 AMEntegris (ENTG): 5/11/2023 6:00 AM Haemonetics (HAE): 5/11/2023 6:00 AM YETI Holdings (YETI): 5/11/2023 6:00 AM National Vision Holdings (EYE): 5/11/2023 6:00 AM Utz Brands (UTZ): 5/11/2023 6:30 AM Circor Intl (CIR): 5/11/2023 6:30 AM Park Aerospace (PKE): 5/11/2023 6:30 AM Veru (VERU): 5/11/2023 6:30 AM Westwater Resources (WWR): 5/11/2023 6:30 AM More from the Next Earnings Dates Calendar Earnings History:BGSF (BGSF): 5/10/2023 5:42 PMFluence Energy (FLNC): 5/10/2023 5:28 PM Riot Platforms (RIOT): 5/10/2023 5:15 PM Excelerate Energy (EE): 5/10/2023 5:08 PM Crane Holdings (CR): 5/10/2023 5:01 PM Epsilon Energy (EPSN): 5/10/2023 5:00 PM OPAL Fuels (OPAL): 5/10/2023 5:00 PM Marpai (MRAI): 5/10/2023 After close SQZ Biotechnologies (SQZ): 5/10/2023 After close Groupon (GRPN): 5/10/2023 After close More from the Earnings History archive |
| Featured Articles |
| Earnings Peers |
| Rayonier Adv Materials (RYAM) is categorized under the Materials sector; to help you further research past earnings across stocks, below are some other companies in the same sector:
RYI Past Earnings SCCO Past Earnings SCHN Past Earnings SCL Past Earnings SEE Past Earnings SGH Past Earnings SHW Past Earnings SLCA Past Earnings SLGN Past Earnings SLVM Past Earnings |
Click the button below for your complimentary copy of Your Early Retirement Portfolio: Dividends Up to 7.8%—Every Month—Forever.
You'll discover the details on 4 stocks and funds that pay you massive dividends as high as 7.8%.