Raven Industries Earnings Surprises image   This RAVN earnings surprises page last updated 12/23/2021
Raven Industries Earnings Surprises Chart
Data adjusted for RAVN split history
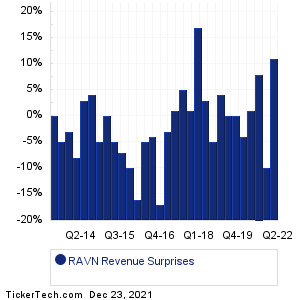
PeriodExpectedActualSurprise
Q2 2022 0.17 0.29 +0.12 (+71%)
Q4 2021 0.11 0.01 -0.10 (-91%)
Q3 2021 0.12 0.24 +0.12 (+100%)
Q2 2021 0.04 0.16 +0.12 (+300%)
Q4 2020 0.05 0.09 +0.04 (+80%)
Q4 2019 0.24 0.11 -0.13 (-54%)
Q3 2019 0.33 0.36 +0.03 (+9%)
Q2 2019 0.30 0.38 +0.08 (+27%)
Q1 2019 0.49 0.50 +0.01 (+2%)
Q4 2018 0.27 0.24 -0.03 (-11%)
Q1 2018 0.24 0.34 +0.10 (+42%)
Q4 2017 0.15 0.12 -0.03 (-20%)
Q3 2017 0.13 0.12 -0.01 (-8%)
Q2 2017 0.09 0.12 +0.03 (+33%)
Q1 2017 0.09 0.15 +0.06 (+67%)
Q4 2016 0.11 0.03 -0.08 (-73%)
Q3 2016 0.17 0.13 -0.04 (-24%)
Q2 2016 0.14 0.11 -0.03 (-21%)
Q1 2016 0.10 0.13 +0.03 (+30%)
Q4 2015 0.19 0.11 -0.08 (-42%)
Q3 2015 0.23 0.18 -0.05 (-22%)
Q2 2015 0.26 0.21 -0.05 (-19%)
Q1 2015 0.33 0.30 -0.03 (-9%)
Q4 2014 0.32 0.23 -0.09 (-28%)
Q3 2014 0.31 0.34 +0.03 (+10%)
Q2 2014 0.27 0.23 -0.04 (-15%)
Q1 2014 0.44 0.38 -0.06 (-14%)
Q4 2013 0.25 0.30 +0.05 (+20%)
Q3 2013 0.34 0.30 -0.04 (-12%)
Q2 2013 0.38 0.32 -0.06 (-16%)
Raven Industries Revenue Surprises Chart
PeriodExpectedActualSurprise
Q2 2022 103.50M 114.43M +10.93M (+11%)
Q4 2021 88.65M 80.08M -8.57M (-10%)
Q3 2021 89.77M 96.61M +6.84M (+8%)
Q2 2021 84.71M 85.18M +469000 (+1%)
Q4 2020 89.55M 85.76M -3.79M (-4%)
Q4 2019 88.10M 88.02M -78000 (-0%)
Q3 2019 104.60M 104.83M +233000 (0%)
Q2 2019 98.94M 102.68M +3.74M (+4%)
Q1 2019 117.04M 111.13M -5.91M (-5%)
Q4 2018 93.33M 95.82M +2.49M (+3%)
Q1 2018 79.87M 93.53M +13.66M (+17%)
Q4 2017 68.50M 68.92M +415000 (+1%)
Q3 2017 69.00M 72.52M +3.52M (+5%)
Q2 2017 67.50M 68.04M +541000 (+1%)
Q1 2017 70.30M 68.36M -1.94M (-3%)
Q4 2016 62.80M 51.84M -10.96M (-17%)
Q3 2016 70.70M 67.61M -3.09M (-4%)
Q2 2016 71.00M 67.52M -3.48M (-5%)
Q1 2016 84.00M 70.27M -13.73M (-16%)
Q4 2015 99.40M 89.87M -9.53M (-10%)
Q3 2015 98.00M 91.29M -6.71M (-7%)
Q2 2015 99.47M 94.50M -4.97M (-5%)
Q1 2015 102.77M 102.50M -0.27M (-0%)
Q4 2014 97.14M 92.60M -4.54M (-5%)
Q3 2014 100.56M 104.90M +4.34M (+4%)
Q2 2014 90.66M 93.40M +2.74M (+3%)
Q1 2014 112.64M 103.70M -8.94M (-8%)
Q4 2013 92.73M 89.60M -3.13M (-3%)
Q3 2013 101.74M 97.00M -4.74M (-5%)
Q2 2013 101.41M 101.70M +290000 (0%)
Quotes delayed 20 minutes

Email EnvelopeFree RAVN Email Alerts:
Get Dividend Alerts
Get SEC Filing Alerts
10 Most Oversold S&P 500 Stocks
10 Most Overbought S&P 500 Stocks
10 ETFs With Stocks Insiders Are Buying
10 ETFs With Most Upside To Targets
The DividendRank Top 25
Warren Buffett Dividend Stocks
10 Cheap Dividend Stocks Under $10
10 Top DividendRank'ed Energy Stocks
The 10 Highest Yielding Preferred Stocks
The 15 Most Active S&P Call & Put Options

Next Earnings Date Calendar:

Aeva Technologies (AEVA): 12/23/2021 4:37 AM
Tuesday Morning (TUEM): 12/23/2021 6:55 AM
Roblox (RBLX): 12/25/2021 3:03 AM
ImmunityBio (IBRX): 12/25/2021 3:06 AM
Canoo (GOEV): 12/25/2021 3:59 AM
JOANN (JOAN): 12/26/2021 4:21 AM
Hayward Holdings (HAYW): 12/27/2021 4:22 AM
Prometheus Biosciences (RXDX): 12/27/2021 4:23 AM
Longboard Pharmaceuticals (LBPH): 12/27/2021 4:34 AM
Ouster (OUST): 12/27/2021 4:35 AM

More from the Next Earnings Dates Calendar

Earnings History:

Mission Produce (AVO): 12/22/2021 After close
Live Ventures (LIVE): 12/22/2021 8:30 AM
Cintas (CTAS): 12/22/2021 8:30 AM
Paychex (PAYX): 12/22/2021 8:30 AM
RF Industries (RFIL): 12/22/2021 8:00 AM
Outlook Therapeutics (OTLK): 12/22/2021 8:00 AM
CarMax (KMX): 12/22/2021 6:50 AM
MSC Industrial Direct Co (MSM): 12/22/2021 6:30 AM
CalAmp (CAMP): 12/21/2021 After close
ShiftPixy (PIXY): 12/21/2021 After close

More from the Earnings History archive
Raven Industries (RAVN) is categorized under the Industrials sector; to help you further research past earnings across stocks, below are some other companies in the same sector:

RBC Past Earnings
RCM Past Earnings
RCMT Past Earnings
RELL Past Earnings
RFIL Past Earnings
RGP Past Earnings
RHI Past Earnings
RMR Past Earnings
ROAD Past Earnings
ROK Past Earnings
On this page we presented the RAVN earnings surprises information for Raven Industries, comparing the expected earnings versus the actual earnings quarter by quarter, with the resulting positive or negative percentage surprise. Any self directed investor doing their due diligence on RAVN (or any other given stock) can benefit from researching all of the Raven Industries past earnings going backwards in time, including how often the company beat or missed the market's expectations. To help you with this Raven Industries earnings surprise research, on this page we presented each quarter's resulting numbers for easy comparison. Studying these numbers can help an investor by providing important context with which to think about RAVN's next earnings report. In your continued research on Raven Industries we hope you will be sure to check out the further links included for revenue and earnings history as well as next earnings dates for RAVN. Thanks for visiting, and the next time you need to research RAVN earnings surprises or those of another stock, we hope you'll think of our site as your go-to earnings surprises research resource of choice.
 

Raven Industries Earnings Surprises | www.NextEarningsDate.com | Copyright © 2020 - 2021, All Rights Reserved

Nothing in NextEarningsDate.com is intended to be investment advice, nor does it represent the opinion of, counsel from, or recommendations by BNK Invest Inc. or any of its affiliates, subsidiaries or partners. None of the information contained herein constitutes a recommendation that any particular security, portfolio, transaction, or investment strategy is suitable for any specific person. All viewers agree that under no circumstances will BNK Invest, Inc,. its subsidiaries, partners, officers, employees, affiliates, or agents be held liable for any loss or damage caused by your reliance on information obtained. By visiting, using or viewing this site, you agree to the following Full Disclaimer & Terms of Use and Privacy Policy. Video widget and market videos powered by Market News Video. Quote and option data delayed at least 15 minutes; stock quote data powered by Ticker Technologies, and Mergent.