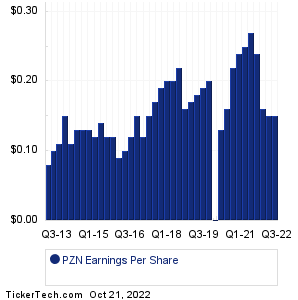
| PZN Earnings History | ||||||||||||||||||||||||||||||||||||||||||||||||||||||||||||||||||||||||||||||||||||||||||||||||||||||||||||||||||||||||
|
|
|
| PZN Earnings History | ||||||||||||||||||||||||||||||||||||||||||||||||||||||||||||||||||||||||||||||||||||||||||||||||||||||||||||||||||||||||
|
|
|
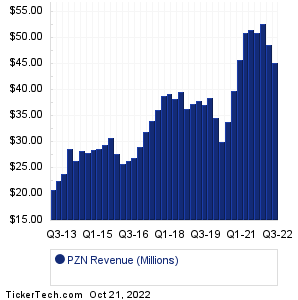
| PZN Revenue History | ||||||||||||||||||||||||||||||||||||||||||||||||||||||||||||||||||||||||||||||||||||||||||||||||||||||||||||||||||||||||
|
| PZN Current Stock Quote |
Get Dividend Alerts Get SEC Filing Alerts |
| PZN Stock Price Chart |
| Next Earnings Dates |
Next Earnings Date Calendar:Regions Financial (RF): 10/21/2022 6:00 AMCentral Pacific Financial (CPF): 10/21/2022 6:30 AM Sensient Technologies (SXT): 10/21/2022 6:55 AM American Express (AXP): 10/21/2022 7:00 AM Schlumberger (SLB): 10/21/2022 7:00 AM Huntington Bancshares (HBAN): 10/21/2022 7:00 AM Interpublic Gr of Cos (IPG): 10/21/2022 7:00 AM Simply Good Foods (SMPL): 10/21/2022 7:00 AM South Plains Financial (SPFI): 10/21/2022 7:00 AM Verizon Communications (VZ): 10/21/2022 7:30 AM More from the Next Earnings Dates Calendar Earnings History:CapStar Financial Hldgs (CSTR): 10/20/2022 10:05 PMChemung Financial (CHMG): 10/20/2022 8:16 PM Richmond Mutual Bancorp (RMBI): 10/20/2022 7:51 PM Oak Valley (OVLY): 10/20/2022 7:18 PM HMN Financial (HMNF): 10/20/2022 7:00 PM Colony Bankcorp (CBAN): 10/20/2022 5:30 PM Brandywine Realty Trust (BDN): 10/20/2022 5:19 PM Capital Bancorp (CBNK): 10/20/2022 5:00 PM P.A.M. Transportation (PTSI): 10/20/2022 5:00 PM First United (FUNC): 10/20/2022 After close More from the Earnings History archive |
| Featured Articles |
| Earnings Peers |
| Pzena Investment Mgmt (PZN) is categorized under the Financials sector; to help you further research past earnings across stocks, below are some other companies in the same sector:
QCRH Past Earnings QTS Past Earnings RADI Past Earnings RBB Past Earnings RBKB Past Earnings RBNC Past Earnings RC Past Earnings RDFN Past Earnings RDN Past Earnings RE Past Earnings |