| PTE Earnings History | ||||||||||||||||||||||||||||||||||||||||||||||||||||||||||||||||||||||||||||||||||||||||||||||||||||||||||||||||||||||||

|
|
|
| PTE Earnings History | ||||||||||||||||||||||||||||||||||||||||||||||||||||||||||||||||||||||||||||||||||||||||||||||||||||||||||||||||||||||||
|
|
|
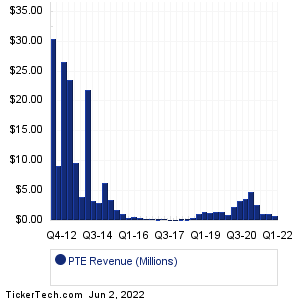
| PTE Revenue History | ||||||||||||||||||||||||||||||||||||||||||||||||||||||||||||||||||||||||||||||||||||||||||||||||||||||||||||||||||||||||
|
| PTE Current Stock Quote |
Get Dividend Alerts Get SEC Filing Alerts |
| PTE Stock Price Chart |
| Next Earnings Dates |
Next Earnings Date Calendar:Hormel Foods (HRL): 6/2/2022 6:30 AMLands' End (LE): 6/2/2022 6:45 AM Ciena (CIEN): 6/2/2022 7:00 AM Designer Brands (DBI): 6/2/2022 7:00 AM SecureWorks (SCWX): 6/2/2022 7:00 AM SpartanNash (SPTN): 6/2/2022 8:00 AM Latham Group (SWIM): 6/2/2022 8:00 AM Duluth Holdings (DLTH): 6/2/2022 8:00 AM NeuroPace (NPCE): 6/2/2022 8:00 AM Toro (TTC): 6/2/2022 8:30 AM More from the Next Earnings Dates Calendar Earnings History:GXO Logistics (GXO): 6/1/2022 5:14 PMSemtech (SMTC): 6/1/2022 After close PVH (PVH): 6/1/2022 After close SentinelOne (S): 6/1/2022 After close UiPath (PATH): 6/1/2022 After close Chewy (CHWY): 6/1/2022 After close Iteris (ITI): 6/1/2022 After close Credo Technology Group (CRDO): 6/1/2022 After close Ncino (NCNO): 6/1/2022 After close Elastic (ESTC): 6/1/2022 After close More from the Earnings History archive |
| Featured Articles |
| Earnings Peers |
| PolarityTE (PTE) is categorized under the Healthcare sector; to help you further research past earnings across stocks, below are some other companies in the same sector:
PTGX Historical Earnings PTIX Historical Earnings PTPI Historical Earnings PULM Historical Earnings QDEL Historical Earnings QLGN Historical Earnings QTRX Historical Earnings RAIN Historical Earnings RANI Historical Earnings RAPT Historical Earnings |
Recommended: EC Average Annual Return, NCI Price Target, Institutional Holders of LDEM.