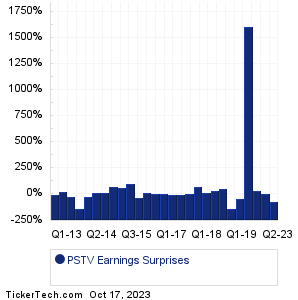
| PSTV Earnings Surprises | ||||||||||||||||||||||||||||||||||||||||||||||||||||||||||||||||||||||||||||||||||||||||||||||||||||||||||||||||
|
|
|
| PSTV Earnings Surprises | ||||||||||||||||||||||||||||||||||||||||||||||||||||||||||||||||||||||||||||||||||||||||||||||||||||||||||||||||
|
|
|
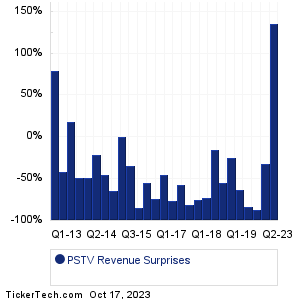
| PSTV Revenue Surprises | ||||||||||||||||||||||||||||||||||||||||||||||||||||||||||||||||||||||||||||||||||||||||||||||||||||||||||||||||
|
| PSTV Current Stock Quote |
Get Dividend Alerts Get SEC Filing Alerts |
| PSTV Stock Price Chart |
| Next Earnings Dates |
Next Earnings Date Calendar:Mercantile Bank (MBWM): 10/17/2023 5:01 AMJohnson & Johnson (JNJ): 10/17/2023 6:20 AM Bank of New York Mellon (BK): 10/17/2023 6:30 AM Bank of America (BAC): 10/17/2023 6:45 AM Cambridge (CATC): 10/17/2023 7:00 AM Lockheed Martin (LMT): 10/17/2023 7:30 AM Goldman Sachs Gr (GS): 10/17/2023 7:30 AM Prologis (PLD): 10/17/2023 8:00 AM Albertsons Companies (ACI): 10/17/2023 8:30 AM United Airlines Holdings (UAL): 10/17/2023 After close More from the Next Earnings Dates Calendar Earnings History:Enerpac Tool Group (EPAC): 10/16/2023 6:10 PMEquity Lifestyle Props (ELS): 10/16/2023 After close FB Financial (FBK): 10/16/2023 After close CrossFirst Bankshares (CFB): 10/16/2023 After close Servisfirst Bancshares (SFBS): 10/16/2023 After close Charles Schwab (SCHW): 10/16/2023 8:00 AM Guaranty Bancshares (GNTY): 10/16/2023 7:00 AM Vintage Wine Estates (VWE): 10/13/2023 After close Hingham Institution (HIFS): 10/13/2023 After close Progressive (PGR): 10/13/2023 8:21 AM More from the Earnings History archive |
| Earnings Peers |
| Plus Therapeutics (PSTV) is categorized under the Healthcare sector; to help you further research past earnings across stocks, below are some other companies in the same sector:
PSTX Historical Earnings PTCT Historical Earnings PTE Historical Earnings PTGX Historical Earnings PTIX Historical Earnings PTPI Historical Earnings PULM Historical Earnings PYXS Historical Earnings QDEL Historical Earnings QLGN Historical Earnings |
Recommended: Funds Holding JDST, HCSG shares outstanding history, NANM Insider Buying.
Click the button below for your complimentary copy of Your Early Retirement Portfolio: Dividends Up to 8.1%—Every Month—Forever.
You'll discover the details on 4 stocks and funds that pay you massive dividends as high as 8.1%.