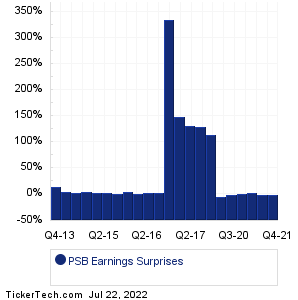
| PSB Earnings Surprises | ||||||||||||||||||||||||||||||||||||||||||||||||||||||||||||||||||||||||||||||||||||||||||||
|
|
|
| PSB Earnings Surprises | ||||||||||||||||||||||||||||||||||||||||||||||||||||||||||||||||||||||||||||||||||||||||||||
|
|
|
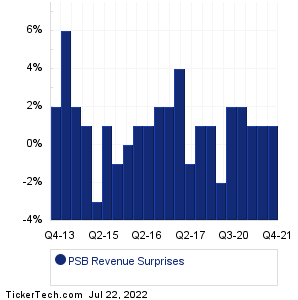
| PSB Revenue Surprises | ||||||||||||||||||||||||||||||||||||||||||||||||||||||||||||||||||||||||||||||||||||||||||||
|
| PSB Current Stock Quote |
Get Dividend Alerts Get SEC Filing Alerts |
| PSB Stock Price Chart |
| Next Earnings Dates |
Next Earnings Date Calendar:Regions Financial (RF): 7/22/2022 6:00 AMCleveland-Cliffs (CLF): 7/22/2022 6:00 AM Roper Technologies (ROP): 7/22/2022 6:55 AM Sensient Technologies (SXT): 7/22/2022 6:55 AM American Express (AXP): 7/22/2022 7:00 AM Schlumberger (SLB): 7/22/2022 7:00 AM First BanCorp (FBP): 7/22/2022 7:00 AM Verizon Communications (VZ): 7/22/2022 7:30 AM NextEra Energy (NEE): 7/22/2022 7:30 AM HCA Healthcare (HCA): 7/22/2022 7:30 AM More from the Next Earnings Dates Calendar Earnings History:CapStar Financial Hldgs (CSTR): 7/21/2022 7:00 PMHilltop Holdings (HTH): 7/21/2022 5:15 PM Amrep (AXR): 7/21/2022 5:00 PM Enterprise Bancorp (EBTC): 7/21/2022 5:00 PM Glacier Bancorp (GBCI): 7/21/2022 After close SVB Financial (SIVB): 7/21/2022 After close First Financial Bancorp (FFBC): 7/21/2022 After close Boston Beer Co (SAM): 7/21/2022 After close Independent Bank (INDB): 7/21/2022 After close WR Berkley (WRB): 7/21/2022 After close More from the Earnings History archive |
| Earnings Peers |
| PS Business Parks (PSB) is categorized under the Financials sector; to help you further research past earnings across stocks, below are some other companies in the same sector:
PSTL Historical Earnings PTRS Historical Earnings PVBC Historical Earnings PWOD Historical Earnings PX Historical Earnings PZN Historical Earnings QCRH Historical Earnings QTS Historical Earnings RBB Historical Earnings RBKB Historical Earnings |
Recommended: PSA Options Chain, Top Ten Hedge Funds Holding BUD, EURZ market cap history.