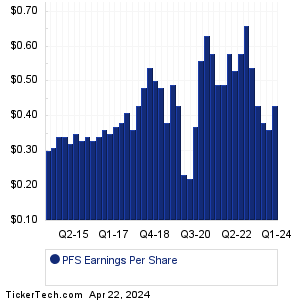
| Provident Finl Servs Earnings History | ||||||||||||||||||||||||||||||||||||||||||||||||||||||||||||||||||||||||||||||||||||||||||||||||||||||||||||||||||
|
|
|
| Provident Finl Servs Earnings History | ||||||||||||||||||||||||||||||||||||||||||||||||||||||||||||||||||||||||||||||||||||||||||||||||||||||||||||||||||
|
|
|
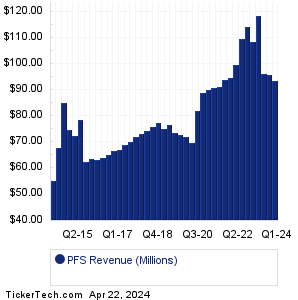
| PFS Revenue History | ||||||||||||||||||||||||||||||||||||||||||||||||||||||||||||||||||||||||||||||||||||||||||||||||||||||||||||||||||
|
| PFS Current Stock Quote |
Get Dividend Alerts Get SEC Filing Alerts |
| PFS Stock Price Chart |
| Next Earnings Dates |
Next Earnings Date Calendar:Loews (L): 5/1/2023 6:00 AMKBR (KBR): 5/1/2023 6:00 AM Park Hotels & Resorts (PK): 5/1/2023 6:30 AM Global Payments (GPN): 5/1/2023 6:55 AM Berkshire Hathaway Inc. New Common Stock (BRK-B): 5/1/2023 7:00 AM WEC Energy Group (WEC): 5/1/2023 7:00 AM Berkshire Hathaway Inc. Common Stock (BRK-A): 5/1/2023 7:00 AM Affiliated Managers Group (AMG): 5/1/2023 7:00 AM SoFi Techs (SOFI): 5/1/2023 7:00 AM Norwegian Cruise Line (NCLH): 5/1/2023 7:30 AM More from the Next Earnings Dates Calendar Earnings History:5E Advanced Materials (FEAM): 4/29/2023 4:08 AMGreenwich LifeSciences (GLSI): 4/28/2023 5:00 PM CB Financial Services (CBFV): 4/28/2023 After close Mid-Southern Bancorp (MSVB): 4/28/2023 After close FNCB Bancorp (FNCB): 4/28/2023 After close Bogota Finl (BSBK): 4/28/2023 After close Marker Therapeutics (MRKR): 4/28/2023 After close Microbot Medical (MBOT): 4/28/2023 After close TFF Pharmaceuticals (TFFP): 4/28/2023 After close Taitron Components (TAIT): 4/28/2023 After close More from the Earnings History archive |
| Featured Articles |
| Earnings Peers |
| Provident Finl Servs (PFS) is categorized under the Financials sector; to help you further research past earnings across stocks, below are some other companies in the same sector:
PFSI Past Earnings PGC Past Earnings PGR Past Earnings PGRE Past Earnings PINE Past Earnings PIPR Past Earnings PJT Past Earnings PK Past Earnings PKBK Past Earnings PLBC Past Earnings |
Recommended: Top Ten Hedge Funds Holding NP, CSTR market cap history, MFN Videos.