| PKI Earnings Surprises | ||||||||||||||||||||||||||||||||||||||||||||||||||||||||||||||||||||||||||||||||||||||||||||||||||||||||||||||||||||||||||||||||||||||||||||||||||||||||
|
|
|
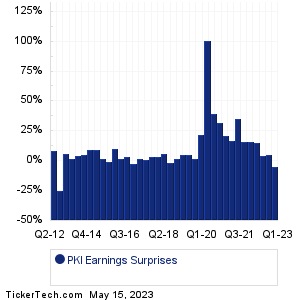
| PKI Earnings Surprises | ||||||||||||||||||||||||||||||||||||||||||||||||||||||||||||||||||||||||||||||||||||||||||||||||||||||||||||||||||||||||||||||||||||||||||||||||||||||||
|
|
|
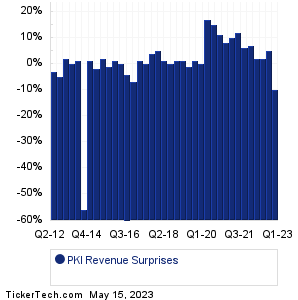
| PKI Revenue Surprises | ||||||||||||||||||||||||||||||||||||||||||||||||||||||||||||||||||||||||||||||||||||||||||||||||||||||||||||||||||||||||||||||||||||||||||||||||||||||||
|
| PKI Current Stock Quote |
Get Dividend Alerts Get SEC Filing Alerts |
| PKI Stock Price Chart |
| Next Earnings Dates |
Next Earnings Date Calendar:Fortune Brands (FBIN): 5/15/2023 2:10 AMAltus Power (AMPS): 5/15/2023 6:00 AM Terran Orbital (LLAP): 5/15/2023 6:00 AM Science 37 Hldgs (SNCE): 5/15/2023 6:00 AM Rockwell Medical (RMTI): 5/15/2023 6:00 AM Novan (NOVN): 5/15/2023 6:30 AM Star Equity Hldgs (STRR): 5/15/2023 6:30 AM Modiv (MDV): 5/15/2023 6:45 AM Catalent (CTLT): 5/15/2023 7:00 AM Fulcrum Therapeutics (FULC): 5/15/2023 7:00 AM More from the Next Earnings Dates Calendar Earnings History:Willamette Valley (WVVI): 5/12/2023 6:00 PMTrean Insurance Group (TIG): 5/12/2023 5:00 PM Boston Omaha (BOC): 5/12/2023 After close Oxbridge Re Holdings (OXBR): 5/12/2023 After close Network-1 Technologies (NTIP): 5/12/2023 After close CEL-SCI (CVM): 5/12/2023 After close Citius Pharma (CTXR): 5/12/2023 After close Comstock Holding Co (CHCI): 5/12/2023 After close FG Finl Gr (FGF): 5/12/2023 After close Generation Income (GIPR): 5/12/2023 After close More from the Earnings History archive |
| Earnings Peers |
| Revvity (PKI) is categorized under the Healthcare sector; to help you further research past earnings across stocks, below are some other companies in the same sector:
PLRX Historical Earnings PLSE Historical Earnings PLXP Historical Earnings PMCB Historical Earnings PMD Historical Earnings PMVP Historical Earnings PNT Historical Earnings POAI Historical Earnings PODD Historical Earnings PRAH Historical Earnings |
Recommended: ENV Insider Buying, JMU market cap history, ETFs Holding FGEN.
Click the button below for your complimentary copy of Your Early Retirement Portfolio: Dividends Up to 7.8%—Every Month—Forever.
You'll discover the details on 4 stocks and funds that pay you massive dividends as high as 7.8%.