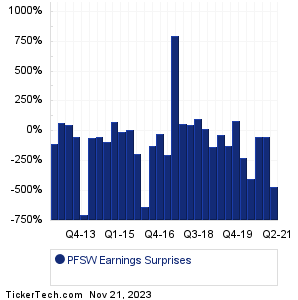
| PFSweb Earnings Surprises | ||||||||||||||||||||||||||||||||||||||||||||||||||||||||||||||||||||||||||||||||||||||||||||||||||||||||||||||||||||||||||||
|
|
|
| PFSweb Earnings Surprises | ||||||||||||||||||||||||||||||||||||||||||||||||||||||||||||||||||||||||||||||||||||||||||||||||||||||||||||||||||||||||||||
|
|
|
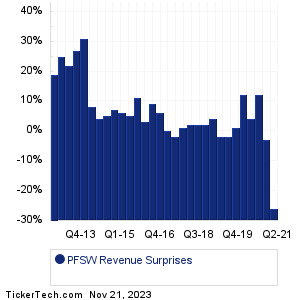
| PFSW Revenue Surprises | ||||||||||||||||||||||||||||||||||||||||||||||||||||||||||||||||||||||||||||||||||||||||||||||||||||||||||||||||||||||||||||
|
| PFSW Current Stock Quote |
Get Dividend Alerts Get SEC Filing Alerts |
| PFSW Stock Price Chart |
| Next Earnings Dates |
Next Earnings Date Calendar:Lowe's Companies (LOW): 11/21/2023 6:00 AMDycom Industries (DY): 11/21/2023 6:00 AM Embecta (EMBC): 11/21/2023 6:30 AM Hibbett (HIBB): 11/21/2023 6:30 AM Jacobs Solutions (J): 11/21/2023 6:40 AM Medtronic (MDT): 11/21/2023 6:45 AM Burlington Stores (BURL): 11/21/2023 6:45 AM Caleres (CAL): 11/21/2023 6:45 AM Analog Devices (ADI): 11/21/2023 7:00 AM Best Buy Co (BBY): 11/21/2023 7:00 AM More from the Next Earnings Dates Calendar Earnings History:Polished.com (POL): 11/20/2023 5:15 PMBellRing Brands (BRBR): 11/20/2023 5:00 PM Xcel Brands (XELB): 11/20/2023 After close BM Technologies (BMTX): 11/20/2023 After close Techprecision (TPCS): 11/20/2023 After close Remark Hldgs (MARK): 11/20/2023 After close Upexi (UPXI): 11/20/2023 After close Presto Automation (PRST): 11/20/2023 After close Symbotic (SYM): 11/20/2023 After close Zoom Video Comms (ZM): 11/20/2023 After close More from the Earnings History archive |
| Earnings Peers |
| PFSweb (PFSW) is categorized under the Technology sector; to help you further research past earnings across stocks, below are some other companies in the same sector:
PHR Historical Earnings PHUN Historical Earnings PI Historical Earnings PING Historical Earnings PLAB Historical Earnings PLAN Historical Earnings PLT Historical Earnings PLTK Historical Earnings PLTR Historical Earnings PLUS Historical Earnings |
Recommended: JRJC Split History, QTM Insider Buying, Funds Holding KFX.
Click the button below for your complimentary copy of Your Early Retirement Portfolio: Dividends Up to 9.5%—Every Month—Forever.
You'll discover the details on 4 stocks and funds that pay you massive dividends as high as 9.5%.