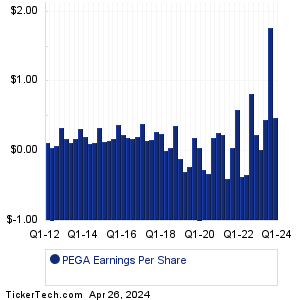
| PEGA Earnings History | ||||||||||||||||||||||||||||||||||||||||||||||||||||||||||||||||||||||||||||||||||||||||||||||||||||||||||||||||||||||||||||||||||||||||||||||||||||||
|
|
|
| PEGA Earnings History | ||||||||||||||||||||||||||||||||||||||||||||||||||||||||||||||||||||||||||||||||||||||||||||||||||||||||||||||||||||||||||||||||||||||||||||||||||||||
|
|
|
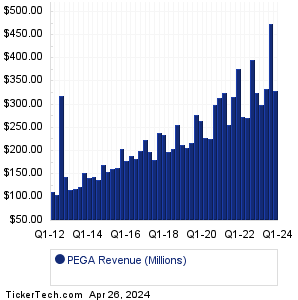
| PEGA Revenue History | ||||||||||||||||||||||||||||||||||||||||||||||||||||||||||||||||||||||||||||||||||||||||||||||||||||||||||||||||||||||||||||||||||||||||||||||||||||||
|
| PEGA Current Stock Quote |
Get Dividend Alerts Get SEC Filing Alerts |
| PEGA Stock Price Chart |
| Next Earnings Dates |
Next Earnings Date Calendar:Portland Gen Electric (POR): 4/26/2024 5:00 AMAon (AON): 4/26/2024 6:00 AM Centene (CNC): 4/26/2024 6:00 AM Ball (BALL): 4/26/2024 6:00 AM US Silica Holdings (SLCA): 4/26/2024 6:00 AM Avantor (AVTR): 4/26/2024 6:05 AM Carter's (CRI): 4/26/2024 6:05 AM Chevron (CVX): 4/26/2024 6:15 AM Exxon Mobil (XOM): 4/26/2024 6:30 AM LyondellBasell Industries (LYB): 4/26/2024 6:30 AM More from the Next Earnings Dates Calendar Earnings History:NOV (NOV): 4/25/2024 6:09 PMSJW Gr (SJW): 4/25/2024 6:00 PM NorthWestern (NWE): 4/25/2024 6:00 PM Provident Bancorp (PVBC): 4/25/2024 6:00 PM First of Long Island (FLIC): 4/25/2024 5:21 PM Customers Bancorp (CUBI): 4/25/2024 5:20 PM Minerals Technologies (MTX): 4/25/2024 5:05 PM Primis Finl (FRST): 4/25/2024 5:00 PM AptarGroup (ATR): 4/25/2024 5:00 PM Codorus Valley Bancorp (CVLY): 4/25/2024 After close More from the Earnings History archive |
| Featured Articles |
| Earnings Peers |
| Pegasystems (PEGA) is categorized under the Technology sector; to help you further research past earnings across stocks, below are some other companies in the same sector:
PEGY Past Earnings PFPT Past Earnings PFSW Past Earnings PHR Past Earnings PHUN Past Earnings PI Past Earnings PING Past Earnings PLAB Past Earnings PLAN Past Earnings PLT Past Earnings |
Click the button below for your complimentary copy of Your Early Retirement Portfolio: Dividends Up to 8.7%—Every Month—Forever.
You'll discover the details on 4 stocks and funds that pay you massive dividends as high as 8.7%.