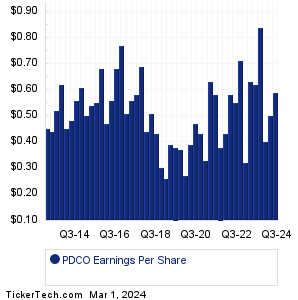
| PDCO Earnings History | ||||||||||||||||||||||||||||||||||||||||||||||||||||||||||||||||||||||||||||||||||||||||||||||||||||||||||||||||||||||||||||||||||||||||||||||||
|
|
|
| PDCO Earnings History | ||||||||||||||||||||||||||||||||||||||||||||||||||||||||||||||||||||||||||||||||||||||||||||||||||||||||||||||||||||||||||||||||||||||||||||||||
|
|
|
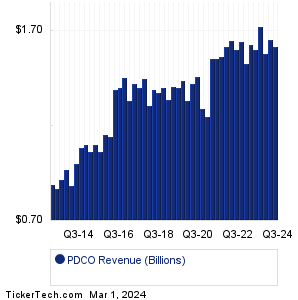
| PDCO Revenue History | ||||||||||||||||||||||||||||||||||||||||||||||||||||||||||||||||||||||||||||||||||||||||||||||||||||||||||||||||||||||||||||||||||||||||||||||||
|
| PDCO Current Stock Quote |
Get Dividend Alerts Get SEC Filing Alerts |
| PDCO Stock Price Chart |
| Next Earnings Dates |
Next Earnings Date Calendar:Biodesix (BDSX): 3/1/2024 6:00 AMAmneal Pharmaceuticals (AMRX): 3/1/2024 6:00 AM inTest (INTT): 3/1/2024 6:30 AM Rapid Micro Biosystems (RPID): 3/1/2024 7:00 AM EchoStar (SATS): 3/1/2024 7:00 AM Plug Power (PLUG): 3/1/2024 7:00 AM FuboTV (FUBO): 3/1/2024 7:30 AM Mammoth Energy Services (TUSK): 3/1/2024 8:00 AM Acme United (ACU): 3/1/2024 9:00 AM LL Flooring Holdings (LL): 3/4/2024 6:00 AM More from the Next Earnings Dates Calendar Earnings History:Seacor Marine Hldgs (SMHI): 2/29/2024 5:05 PMNational Western Life (NWLI): 2/29/2024 5:00 PM Ginkgo Bioworks Holdings (DNA): 2/29/2024 5:00 PM Forum Energy Technologies (FET): 2/29/2024 After close MasTec (MTZ): 2/29/2024 After close Douglas Elliman (DOUG): 2/29/2024 After close Green Brick Partners (GRBK): 2/29/2024 After close Quaker Houghton (KWR): 2/29/2024 After close FTAI Infrastructure (FIP): 2/29/2024 After close Saul Centers (BFS): 2/29/2024 After close More from the Earnings History archive |
| Featured Articles |
| Earnings Peers |
| Patterson Cos (PDCO) is categorized under the Healthcare sector; to help you further research past earnings across stocks, below are some other companies in the same sector:
PDEX Past Earnings PDSB Past Earnings PEN Past Earnings PEPG Past Earnings PETV Past Earnings PFE Past Earnings PGEN Past Earnings PGNY Past Earnings PHAS Past Earnings PHAT Past Earnings |
Recommended: Top Ten Hedge Funds Holding BSJH, CS Videos, IBDL Videos.
Click the button below for your complimentary copy of Your Early Retirement Portfolio: Dividends Up to 9.5%—Every Month—Forever.
You'll discover the details on 4 stocks and funds that pay you massive dividends as high as 9.5%.