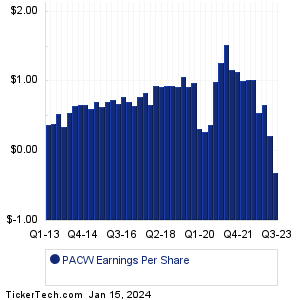
| PacWest Banc Earnings History | ||||||||||||||||||||||||||||||||||||||||||||||||||||||||||||||||||||||||||||||||||||||||||||||||||||||||||||||||||||||||||||||||||||
|
|
|
| PacWest Banc Earnings History | ||||||||||||||||||||||||||||||||||||||||||||||||||||||||||||||||||||||||||||||||||||||||||||||||||||||||||||||||||||||||||||||||||||
|
|
|
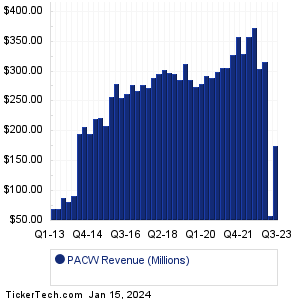
| PACW Revenue History | ||||||||||||||||||||||||||||||||||||||||||||||||||||||||||||||||||||||||||||||||||||||||||||||||||||||||||||||||||||||||||||||||||||
|
| PACW Current Stock Quote |
Get Dividend Alerts Get SEC Filing Alerts |
| PACW Stock Price Chart |
| Next Earnings Dates |
Next Earnings Date Calendar:Mercantile Bank (MBWM): 1/16/2024 5:01 AMFB Financial (FBK): 1/16/2024 6:00 AM PNC Finl Servs Gr (PNC): 1/16/2024 6:30 AM Guaranty Bancshares (GNTY): 1/16/2024 7:00 AM Goldman Sachs Gr (GS): 1/16/2024 7:30 AM Morgan Stanley (MS): 1/16/2024 7:30 AM Applied Digital (APLD): 1/16/2024 8:00 AM Interactive Brokers Gr (IBKR): 1/16/2024 After close Hancock Whitney (HWC): 1/16/2024 After close Citius Pharma (CTXR): 1/16/2024 After close More from the Next Earnings Dates Calendar Earnings History:Pure Cycle (PCYO): 1/12/2024 After closeCitigroup (C): 1/12/2024 8:00 AM Wells Fargo (WFC): 1/12/2024 6:48 AM Bank of America (BAC): 1/12/2024 6:45 AM JPMorgan Chase (JPM): 1/12/2024 6:45 AM Delta Air Lines (DAL): 1/12/2024 6:30 AM Bank of New York Mellon (BK): 1/12/2024 6:30 AM Unity Bancorp (UNTY): 1/12/2024 6:00 AM BlackRock (BLK): 1/12/2024 6:00 AM UnitedHealth Group (UNH): 1/12/2024 5:55 AM More from the Earnings History archive |
| Featured Articles |
| Earnings Peers |
| PacWest Banc (PACW) is categorized under the Financials sector; to help you further research past earnings across stocks, below are some other companies in the same sector:
PB Past Earnings PBBK Past Earnings PBCT Past Earnings PBFS Past Earnings PBHC Past Earnings PBIP Past Earnings PCB Past Earnings PCH Past Earnings PCSB Past Earnings PDLB Past Earnings |
Recommended: ETFs Holding NEFF, Institutional Holders of CELZ, BGG Options Chain.
Click the button below for your complimentary copy of Your Early Retirement Portfolio: Dividends Up to 9.5%—Every Month—Forever.
You'll discover the details on 4 stocks and funds that pay you massive dividends as high as 9.5%.