| Orion Energy Sys Earnings Surprises | ||||||||||||||||||||||||||||||||||||||||||||||||||||||||||||||||||||||||||||||||||||||||||||||||||||||||||||||||||||||||
|
|
|
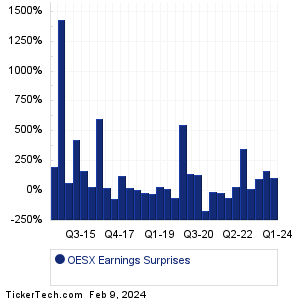
| Orion Energy Sys Earnings Surprises | ||||||||||||||||||||||||||||||||||||||||||||||||||||||||||||||||||||||||||||||||||||||||||||||||||||||||||||||||||||||||
|
|
|
| OESX Revenue Surprises | ||||||||||||||||||||||||||||||||||||||||||||||||||||||||||||||||||||||||||||||||||||||||||||||||||||||||||||||||||||||||

|
| OESX Current Stock Quote |
Get Dividend Alerts Get SEC Filing Alerts |
| OESX Stock Price Chart |
| Next Earnings Dates |
Next Earnings Date Calendar:Hooker Furnishings (HOFT): 6/8/2023 6:00 AMGraham (GHM): 6/8/2023 6:30 AM Designer Brands (DBI): 6/8/2023 6:45 AM Signet Jewelers (SIG): 6/8/2023 7:00 AM FuelCell Energy (FCEL): 6/8/2023 7:00 AM REV Group (REVG): 6/8/2023 7:00 AM SecureWorks (SCWX): 6/8/2023 7:00 AM Kirkland's (KIRK): 6/8/2023 7:00 AM AstroNova (ALOT): 6/8/2023 7:30 AM Toro (TTC): 6/8/2023 8:30 AM More from the Next Earnings Dates Calendar Earnings History:Hyzon Motors (HYZN): 6/7/2023 After closeLakeland Industries (LAKE): 6/7/2023 After close Urstadt Biddle Properties (UBP): 6/7/2023 After close Urstadt Biddle Properties (UBA): 6/7/2023 After close Semtech (SMTC): 6/7/2023 After close Greif (GEF): 6/7/2023 After close GameStop (GME): 6/7/2023 After close Oxford Industries (OXM): 6/7/2023 After close HashiCorp (HCP): 6/7/2023 After close Verint Systems (VRNT): 6/7/2023 After close More from the Earnings History archive |
| Earnings Peers |
| Orion Energy Sys (OESX) is categorized under the Industrials sector; to help you further research past earnings across stocks, below are some other companies in the same sector:
OFLX Historical Earnings OIG Historical Earnings OMEX Historical Earnings OPRX Historical Earnings ORN Historical Earnings OSG Historical Earnings OSS Historical Earnings OTIS Historical Earnings PALT Historical Earnings PATI Historical Earnings |
Recommended: BCK Historical Stock Prices, CAFN Historical Stock Prices, MBLY Price Target.
Click the button below for your complimentary copy of Your Early Retirement Portfolio: Dividends Up to 7.8%—Every Month—Forever.
You'll discover the details on 4 stocks and funds that pay you massive dividends as high as 7.8%.