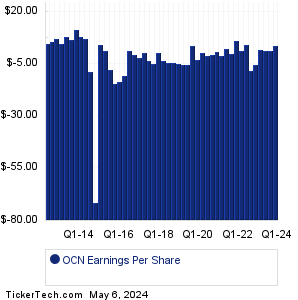
| Ocwen Financial Earnings History | ||||||||||||||||||||||||||||||||||||||||||||||||||||||||||||||||||||||||||||||||||||||||||||||||||||||||||||||||||||||||||||||||||||||||||||||||
|
|
|
| Ocwen Financial Earnings History | ||||||||||||||||||||||||||||||||||||||||||||||||||||||||||||||||||||||||||||||||||||||||||||||||||||||||||||||||||||||||||||||||||||||||||||||||
|
|
|
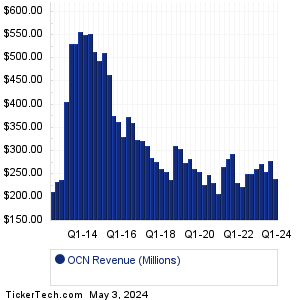
| OCN Revenue History | ||||||||||||||||||||||||||||||||||||||||||||||||||||||||||||||||||||||||||||||||||||||||||||||||||||||||||||||||||||||||||||||||||||||||||||||||
|
| OCN Current Stock Quote |
Get Dividend Alerts Get SEC Filing Alerts |
| OCN Stock Price Chart |
| Next Earnings Dates |
Next Earnings Date Calendar:Radiant Logistics (RLGT): 3/25/2024 8:00 AMTheriva Biologics (TOVX): 3/25/2024 8:00 AM Bitcoin Depot (BTM): 3/25/2024 8:05 AM BuzzFeed (BZFD): 3/25/2024 After close Lucid Diagnostics (LUCD): 3/25/2024 After close Rekor Systems (REKR): 3/25/2024 After close Sanara MedTech (SMTI): 3/25/2024 After close Ampco-Pittsburgh (AP): 3/25/2024 After close Excelerate Energy (EE): 3/25/2024 5:00 PM Granite Ridge Resources (GRNT): 3/25/2024 5:00 PM More from the Next Earnings Dates Calendar Earnings History:Tandy Leather Factory (TLF): 3/22/2024 After closeMoleculin Biotech (MBRX): 3/22/2024 After close Luther Burbank (LBC): 3/22/2024 After close Zymeworks (ZYME): 3/22/2024 After close Pliant Therapeutics (PLRX): 3/22/2024 After close Union Bankshares (UNB): 3/22/2024 2:00 PM Solitario Zinc (XPL): 3/22/2024 9:30 AM United-Guardian (UG): 3/22/2024 9:00 AM Star Equity Hldgs (STRR): 3/22/2024 8:30 AM Servotronics (SVT): 3/22/2024 8:30 AM More from the Earnings History archive |
| Featured Articles |
| Earnings Peers |
| Ocwen Financial (OCN) is categorized under the Financials sector; to help you further research past earnings across stocks, below are some other companies in the same sector:
OFC Past Earnings OFED Past Earnings OFG Past Earnings OHI Past Earnings OLP Past Earnings OMF Past Earnings ONB Past Earnings ONL Past Earnings OPAD Past Earnings OPBK Past Earnings |
Recommended: Funds Holding VPFG, ETFs Holding SM, PSCI Videos.
Click the button below for your complimentary copy of Your Early Retirement Portfolio: Dividends Up to 9.5%—Every Month—Forever.
You'll discover the details on 4 stocks and funds that pay you massive dividends as high as 9.5%.