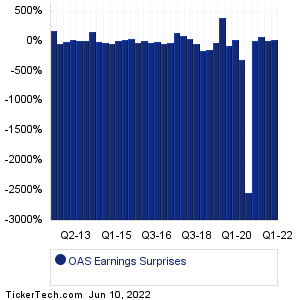
| Oasis Petroleum Earnings Surprises | ||||||||||||||||||||||||||||||||||||||||||||||||||||||||||||||||||||||||||||||||||||||||||||||||||||||||||||||||||||||||||||||||||||||||||||||||
|
|
|
| Oasis Petroleum Earnings Surprises | ||||||||||||||||||||||||||||||||||||||||||||||||||||||||||||||||||||||||||||||||||||||||||||||||||||||||||||||||||||||||||||||||||||||||||||||||
|
|
|
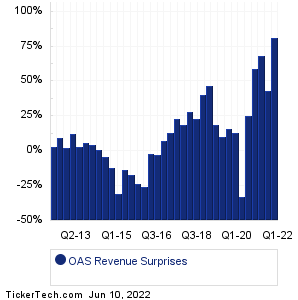
| OAS Revenue Surprises | ||||||||||||||||||||||||||||||||||||||||||||||||||||||||||||||||||||||||||||||||||||||||||||||||||||||||||||||||||||||||||||||||||||||||||||||||
|
| OAS Current Stock Quote |
Get Dividend Alerts Get SEC Filing Alerts |
| OAS Stock Price Chart |
| Next Earnings Dates |
Next Earnings Date Calendar:MeridianLink (MLNK): 6/11/2022 After closeMaxCyte (MXCT): 6/13/2022 After close PFSweb (PFSW): 6/13/2022 After close Talaris Therapeutics (TALS): 6/13/2022 After close Oracle (ORCL): 6/13/2022 After close Braze (BRZE): 6/13/2022 After close Intellicheck (IDN): 6/13/2022 After close Zedge (ZDGE): 6/13/2022 After close Solid Biosciences (SLDB): 6/14/2022 6:00 AM Core & Main (CNM): 6/14/2022 7:30 AM More from the Next Earnings Dates Calendar Earnings History:Enzo Biochem (ENZ): 6/9/2022 After closeStitch Fix (SFIX): 6/9/2022 After close DocuSign (DOCU): 6/9/2022 After close Comtech Telecomms (CMTL): 6/9/2022 After close Rent the Runway (RENT): 6/9/2022 After close Lakeland Industries (LAKE): 6/9/2022 After close Bowman Consulting Group (BWMN): 6/9/2022 After close RxSight (RXST): 6/9/2022 After close Vail Resorts (MTN): 6/9/2022 After close Absci (ABSI): 6/9/2022 8:30 AM More from the Earnings History archive |
| Earnings Peers |
| Oasis Petroleum (OAS) is categorized under the Energy sector; to help you further research past earnings across stocks, below are some other companies in the same sector:
OEC Past Earnings OII Past Earnings OIS Past Earnings OKE Past Earnings OVV Past Earnings OXY Past Earnings PARR Past Earnings PBF Past Earnings PDCE Past Earnings PFIE Past Earnings |
Recommended: NX Earnings History, VIDE Insider Buying, Funds Holding VS.