NXPI Earnings Surprises image   This NXPI earnings surprises page last updated 12/29/2021
NXPI Earnings Surprises Chart
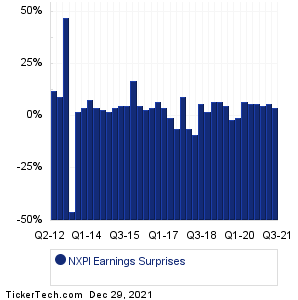
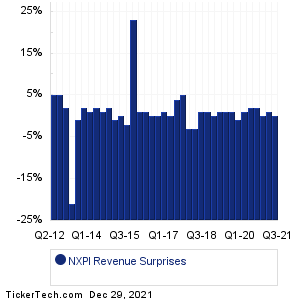
Data adjusted for NXPI split history

PeriodExpectedActualSurprise
Q3 2021 2.74 2.84 +0.10 (+4%)
Q2 2021 2.31 2.44 +0.13 (+6%)
Q1 2021 2.21 2.31 +0.10 (+5%)
Q4 2020 2.10 2.22 +0.12 (+6%)
Q3 2020 1.53 1.62 +0.09 (+6%)
Q2 2020 0.85 0.91 +0.06 (+7%)
Q1 2020 1.41 1.40 -0.01 (-1%)
Q4 2019 2.02 1.98 -0.04 (-2%)
Q3 2019 1.93 2.02 +0.09 (+5%)
Q2 2019 1.78 1.91 +0.13 (+7%)
Q1 2019 1.55 1.66 +0.11 (+7%)
Q4 2018 2.08 2.13 +0.05 (+2%)
Q3 2018 1.89 2.01 +0.12 (+6%)
Q2 2018 1.65 1.50 -0.15 (-9%)
Q1 2018 1.68 1.58 -0.10 (-6%)
Q4 2017 1.79 1.96 +0.17 (+9%)
Q3 2017 1.69 1.59 -0.10 (-6%)
Q2 2017 1.52 1.51 -0.01 (-1%)
Q1 2017 1.35 1.40 +0.05 (+4%)
Q4 2016 1.65 1.76 +0.11 (+7%)
Q3 2016 1.60 1.66 +0.06 (+4%)
Q2 2016 1.35 1.39 +0.04 (+3%)
Q1 2016 1.09 1.14 +0.05 (+5%)
Q4 2015 1.07 1.25 +0.18 (+17%)
Q3 2015 1.50 1.57 +0.07 (+5%)
Q2 2015 1.37 1.44 +0.07 (+5%)
Q1 2015 1.30 1.35 +0.05 (+4%)
Q4 2014 1.32 1.35 +0.03 (+2%)
Q3 2014 1.31 1.35 +0.04 (+3%)
Q2 2014 1.05 1.09 +0.04 (+4%)
Q1 2014 0.91 0.98 +0.07 (+8%)
Q4 2013 0.95 0.99 +0.04 (+4%)
Q3 2013 0.83 0.85 +0.02 (+2%)
Q2 2013 1.32 0.71 -0.61 (-46%)
Q1 2013 0.49 0.72 +0.23 (+47%)
Q4 2012 0.46 0.50 +0.04 (+9%)
Q2 2012 0.40 0.45 +0.05 (+12%)
NXPI Revenue Surprises Chart
PeriodExpectedActualSurprise
Q3 2021 2.85B 2.86B +11.00M (0%)
Q2 2021 2.58B 2.60B +16.00M (+1%)
Q1 2021 2.56B 2.57B +7.00M (0%)
Q4 2020 2.46B 2.51B +47.00M (+2%)
Q3 2020 2.23B 2.27B +37.00M (+2%)
Q2 2020 1.80B 1.82B +17.00M (+1%)
Q1 2020 2.04B 2.02B -19.00M (-1%)
Q4 2019 2.28B 2.30B +21.00M (+1%)
Q3 2019 2.24B 2.27B +25.00M (+1%)
Q2 2019 2.20B 2.22B +17.00M (+1%)
Q1 2019 2.09B 2.09B +4.00M (0%)
Q4 2018 2.38B 2.40B +23.00M (+1%)
Q3 2018 2.43B 2.44B +15.00M (0%)
Q2 2018 2.36B 2.29B -70.00M (-3%)
Q1 2018 2.35B 2.27B -81.00M (-3%)
Q4 2017 2.34B 2.46B +116.00M (+5%)
Q3 2017 2.29B 2.39B +97.00M (+4%)
Q2 2017 2.20B 2.20B +2.00M (0%)
Q1 2017 2.19B 2.21B +21.00M (+1%)
Q4 2016 2.44B 2.44B NA (0%)
Q3 2016 2.46B 2.47B +9.00M (0%)
Q2 2016 2.35B 2.37B +15.00M (+1%)
Q1 2016 2.21B 2.22B +14.00M (0%)
Q4 2015 1.31B 1.61B +296.00M (+23%)
Q3 2015 1.55B 1.52B -28.00M (-2%)
Q2 2015 1.51B 1.51B -4.00M (0%)
Q1 2015 1.48B 1.47B -13.00M (-1%)
Q4 2014 1.51B 1.54B +27.00M (+2%)
Q3 2014 1.50B 1.52B +20.00M (+1%)
Q2 2014 1.33B 1.35B +20.00M (+2%)
Q1 2014 1.23B 1.25B +16.00M (+2%)
Q4 2013 1.27B 1.29B +23.00M (+2%)
Q3 2013 1.26B 1.25B -10.00M (-1%)
Q2 2013 1.51B 1.19B -0.32B (-21%)
Q1 2013 1.07B 1.09B +20.00M (+2%)
Q4 2012 1.07B 1.12B +50.00M (+5%)
Q2 2012 1.05B 1.10B +50.00M (+5%)
Quotes delayed 20 minutes

Email EnvelopeFree NXPI Email Alerts:
Get Dividend Alerts
Get SEC Filing Alerts
10 Most Oversold S&P 500 Stocks
10 Most Overbought S&P 500 Stocks
10 ETFs With Stocks Insiders Are Buying
10 ETFs With Most Upside To Targets
The DividendRank Top 25
Warren Buffett Dividend Stocks
10 Cheap Dividend Stocks Under $10
10 Top DividendRank'ed Energy Stocks
The 10 Highest Yielding Preferred Stocks
The 15 Most Active S&P Call & Put Options

Next Earnings Date Calendar:

FuelCell Energy (FCEL): 12/29/2021 7:30 AM
D.R. Horton (DHI): 1/2/2022 6:30 AM
MillerKnoll (MLKN): 1/4/2022 After close
SMART Global Holdings (SGH): 1/4/2022 After close
Urstadt Biddle Properties (UBP): 1/4/2022 After close
RPM International (RPM): 1/5/2022 6:45 AM
Simply Good Foods (SMPL): 1/5/2022 7:00 AM
UniFirst (UNF): 1/5/2022 8:00 AM
Landec (LNDC): 1/5/2022 After close
Resources Connection (RGP): 1/5/2022 After close

More from the Next Earnings Dates Calendar

Earnings History:

Cal-Maine Foods (CALM): 12/28/2021 After close
Nautilus (NLS): 12/27/2021 After close
Addvantage Technologies (AEY): 12/27/2021 After close
Anavex Life Sciences (AVXL): 12/27/2021 After close
Raven Industries (RAVN): 12/27/2021 After close
E2open Parent Holdings (ETWO): 12/27/2021 8:55 AM
CSP (CSPI): 12/27/2021 8:00 AM
Ouster (OUST): 12/27/2021 4:35 AM
Longboard Pharmaceuticals (LBPH): 12/27/2021 4:34 AM
Prometheus Biosciences (RXDX): 12/27/2021 4:23 AM

More from the Earnings History archive
NXP Semiconductors (NXPI) is categorized under the Technology sector; to help you further research past earnings across stocks, below are some other companies in the same sector:

NXTD Past Earnings
OB Past Earnings
OBLG Past Earnings
OKTA Past Earnings
OLB Past Earnings
OLED Past Earnings
OLO Past Earnings
OMCL Past Earnings
ON Past Earnings
ONTF Past Earnings
On this page we presented the NXPI earnings surprises information for NXP Semiconductors, comparing the expected earnings versus the actual earnings quarter by quarter, with the resulting positive or negative percentage surprise. Any self directed investor doing their due diligence on NXPI (or any other given stock) can benefit from researching all of the NXP Semiconductors past earnings going backwards in time, including how often the company beat or missed the market's expectations. To help you with this NXP Semiconductors earnings surprise research, on this page we presented each quarter's resulting numbers for easy comparison. Studying these numbers can help an investor by providing important context with which to think about NXPI's next earnings report. In your continued research on NXP Semiconductors we hope you will be sure to check out the further links included for revenue and earnings history as well as next earnings dates for NXPI. Thanks for visiting, and the next time you need to research NXPI earnings surprises or those of another stock, we hope you'll think of our site as your go-to earnings surprises research resource of choice.
 

NXPI Earnings Surprises | www.NextEarningsDate.com | Copyright © 2020 - 2021, All Rights Reserved

Nothing in NextEarningsDate.com is intended to be investment advice, nor does it represent the opinion of, counsel from, or recommendations by BNK Invest Inc. or any of its affiliates, subsidiaries or partners. None of the information contained herein constitutes a recommendation that any particular security, portfolio, transaction, or investment strategy is suitable for any specific person. All viewers agree that under no circumstances will BNK Invest, Inc,. its subsidiaries, partners, officers, employees, affiliates, or agents be held liable for any loss or damage caused by your reliance on information obtained. By visiting, using or viewing this site, you agree to the following Full Disclaimer & Terms of Use and Privacy Policy. Video widget and market videos powered by Market News Video. Quote and option data delayed at least 15 minutes; stock quote data powered by Ticker Technologies, and Mergent.