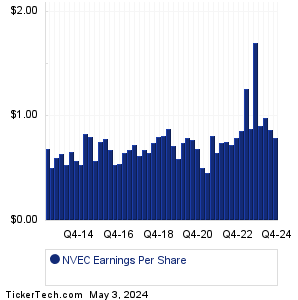
| NVEC Earnings History | ||||||||||||||||||||||||||||||||||||||||||||||||||||||||||||||||||||||||||||||||||||||||||||||||||||||||||||||||||||||||||||||||||||||||||||||||
|
|
|
| NVEC Earnings History | ||||||||||||||||||||||||||||||||||||||||||||||||||||||||||||||||||||||||||||||||||||||||||||||||||||||||||||||||||||||||||||||||||||||||||||||||
|
|
|
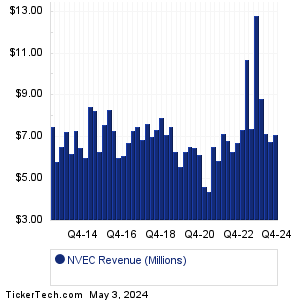
| NVEC Revenue History | ||||||||||||||||||||||||||||||||||||||||||||||||||||||||||||||||||||||||||||||||||||||||||||||||||||||||||||||||||||||||||||||||||||||||||||||||
|
| NVEC Current Stock Quote |
Get Dividend Alerts Get SEC Filing Alerts |
| NVEC Stock Price Chart |
| Next Earnings Dates |
Next Earnings Date Calendar:Regions Finl (RF): 1/19/2024 6:00 AMFifth Third Bancorp (FITB): 1/19/2024 6:30 AM Comerica (CMA): 1/19/2024 6:40 AM SLB (SLB): 1/19/2024 6:50 AM Travelers Companies (TRV): 1/19/2024 6:57 AM Huntington Bancshares (HBAN): 1/19/2024 7:00 AM State Street (STT): 1/19/2024 7:30 AM Ally Financial (ALLY): 1/19/2024 7:30 AM World Acceptance (WRLD): 1/19/2024 7:30 AM COPT Defense (CDP): 1/20/2024 5:36 PM More from the Next Earnings Dates Calendar Earnings History:F N B (FNB): 1/18/2024 After closeOceanFirst Financial (OCFC): 1/18/2024 After close BancFirst (BANF): 1/18/2024 After close Independent Bank (INDB): 1/18/2024 After close Southern First Bancshares (SFST): 1/18/2024 After close 1st Source (SRCE): 1/18/2024 After close Metropolitan Bank Holding (MCB): 1/18/2024 After close JB Hunt Transport Servs (JBHT): 1/18/2024 After close PPG Indus (PPG): 1/18/2024 After close Bank OZK (OZK): 1/18/2024 After close More from the Earnings History archive |
| Featured Articles |
| Earnings Peers |
| NVE (NVEC) is categorized under the Technology sector; to help you further research past earnings across stocks, below are some other companies in the same sector:
NXGN Past Earnings NXPI Past Earnings NXTD Past Earnings NXTP Past Earnings OB Past Earnings OBLG Past Earnings OKTA Past Earnings OLB Past Earnings OLED Past Earnings OLO Past Earnings |
Click the button below for your complimentary copy of Your Early Retirement Portfolio: Dividends Up to 9.5%—Every Month—Forever.
You'll discover the details on 4 stocks and funds that pay you massive dividends as high as 9.5%.