| NPTN Earnings Surprises | ||||||||||||||||||||||||||||||||||||||||||||||||||||||||||||||||||||||||||||||||||||||||||||||||||||||||||||||||||||||||||||||||||||||||||||||||||||
|
|
|
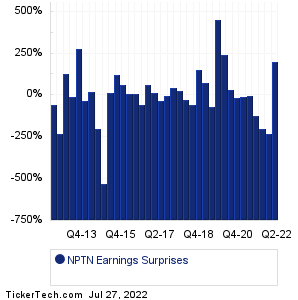
| NPTN Earnings Surprises | ||||||||||||||||||||||||||||||||||||||||||||||||||||||||||||||||||||||||||||||||||||||||||||||||||||||||||||||||||||||||||||||||||||||||||||||||||||
|
|
|
| NPTN Revenue Surprises | ||||||||||||||||||||||||||||||||||||||||||||||||||||||||||||||||||||||||||||||||||||||||||||||||||||||||||||||||||||||||||||||||||||||||||||||||||||

|
| NPTN Current Stock Quote |
Get Dividend Alerts Get SEC Filing Alerts |
| NPTN Stock Price Chart |
| Next Earnings Dates |
Next Earnings Date Calendar:TE Connectivity (TEL): 7/27/2022 6:00 AMHilton Worldwide Holdings (HLT): 7/27/2022 6:00 AM Otis Worldwide (OTIS): 7/27/2022 6:00 AM Bunge (BG): 7/27/2022 6:00 AM Owens-Corning (OC): 7/27/2022 6:00 AM Integra Lifesciences (IART): 7/27/2022 6:00 AM Universal Stainless (USAP): 7/27/2022 6:00 AM Taylor Morrison Home (TMHC): 7/27/2022 6:15 AM Humana (HUM): 7/27/2022 6:30 AM Boston Scientific (BSX): 7/27/2022 6:30 AM More from the Next Earnings Dates Calendar Earnings History:Boston Properties (BXP): 7/26/2022 5:02 PMTessco Technologies (TESS): 7/26/2022 5:00 PM Landmark Bancorp (LARK): 7/26/2022 5:00 PM Investar Holding (ISTR): 7/26/2022 5:00 PM Flushing Financial (FFIC): 7/26/2022 5:00 PM First Busey (BUSE): 7/26/2022 5:00 PM Hudson Pacific Properties (HPP): 7/26/2022 5:00 PM UMB Financial (UMBF): 7/26/2022 5:00 PM Ashland Global Holdings (ASH): 7/26/2022 5:00 PM Teradyne (TER): 7/26/2022 5:00 PM More from the Earnings History archive |
| Earnings Peers |
| NeoPhotonics (NPTN) is categorized under the Technology sector; to help you further research past earnings across stocks, below are some other companies in the same sector:
NRDY Historical Earnings NSIT Historical Earnings NSSC Historical Earnings NTAP Historical Earnings NTCT Historical Earnings NTGR Historical Earnings NTNX Historical Earnings NTWK Historical Earnings NUAN Historical Earnings NVDA Historical Earnings |
Recommended: OAK Historical Stock Prices, Funds Holding WLB, GCBC Next Dividend Date.