NLS Earnings Surprises image   This NLS earnings surprises page last updated 11/7/2023
NLS Earnings Surprises Chart
PeriodExpectedActualSurprise
Q1 2024 -0.44 -0.15 +0.29 (-66%)
Q4 2023 -0.50 -0.58 -0.08 (+16%)
Q3 2023 -0.27 -0.35 -0.08 (+30%)
Q2 2023 -0.50 -0.48 +0.02 (-4%)
Q1 2023 -0.71 -1.06 -0.35 (+49%)
Q3 2022 -0.49 -0.43 +0.06 (-12%)
Q2 2022 0.10 0.03 -0.07 (-70%)
Q1 2021 0.52 0.94 +0.42 (+81%)
Q4 2020 0.75 0.97 +0.22 (+29%)
Q3 2020 0.32 0.87 +0.55 (+172%)
Q2 2020 -0.09 0.56 +0.65 (-722%)
Q1 2020 -0.08 0.08 +0.16 (-200%)
Q4 2019 -0.14 0.12 +0.26 (-186%)
Q3 2019 -0.02 -0.36 -0.34 (+1700%)
Q2 2019 -0.17 -0.25 -0.08 (+47%)
Q1 2019 -0.03 -0.29 -0.26 (+867%)
Q4 2018 0.04 0.05 +0.01 (+25%)
Q3 2018 0.17 0.15 -0.02 (-12%)
Q2 2018 0.04 0.03 -0.01 (-25%)
Q1 2018 0.20 0.27 +0.07 (+35%)
Q4 2017 0.31 0.27 -0.04 (-13%)
Q3 2017 0.24 0.27 +0.03 (+13%)
Q2 2017 0.10 0.08 -0.02 (-20%)
Q4 2016 0.41 0.38 -0.03 (-7%)
Q3 2016 0.14 0.16 +0.02 (+14%)
Q2 2016 0.09 0.12 +0.03 (+33%)
Q1 2016 0.35 0.38 +0.03 (+9%)
Q4 2015 0.38 0.39 +0.01 (+3%)
Q3 2015 0.09 0.12 +0.03 (+33%)
Q1 2015 0.24 0.34 +0.10 (+42%)
Q4 2014 0.32 0.33 +0.01 (+3%)
Q1 2014 0.14 0.17 +0.03 (+21%)
Q3 2012 -0.01 0.03 +0.04 (-400%)
Q2 2012 -0.07 -0.02 +0.05 (-71%)
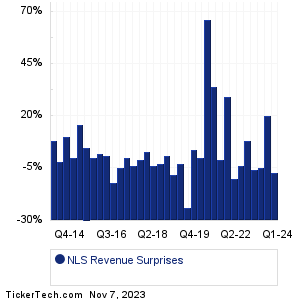
NLS Revenue Surprises Chart
PeriodExpectedActualSurprise
Q1 2024 44.88M 41.75M -3.13M (-7%)
Q4 2023 57.07M 68.42M +11.35M (+20%)
Q3 2023 103.50M 98.08M -5.42M (-5%)
Q2 2023 69.38M 65.46M -3.92M (-6%)
Q1 2023 50.90M 54.82M +3.92M (+8%)
Q3 2022 153.09M 147.26M -5.83M (-4%)
Q2 2022 152.73M 137.96M -14.77M (-10%)
Q1 2021 159.15M 206.07M +46.92M (+29%)
Q4 2020 191.73M 189.26M -2.47M (-1%)
Q3 2020 115.67M 155.39M +39.72M (+34%)
Q2 2020 68.74M 114.19M +45.45M (+66%)
Q1 2020 93.82M 93.72M -98000 (-0%)
Q4 2019 99.78M 104.17M +4.39M (+4%)
Q3 2019 81.40M 61.71M -19.69M (-24%)
Q2 2019 60.91M 59.00M -1.91M (-3%)
Q1 2019 92.15M 84.40M -7.75M (-8%)
Q4 2018 114.71M 115.39M +675000 (+1%)
Q3 2018 94.12M 91.06M -3.06M (-3%)
Q2 2018 78.67M 75.50M -3.17M (-4%)
Q1 2018 111.77M 114.81M +3.04M (+3%)
Q4 2017 128.65M 127.77M -0.88M (-1%)
Q3 2017 91.85M 88.13M -3.72M (-4%)
Q2 2017 77.22M 77.03M -0.19M (-0%)
Q4 2016 131.96M 125.76M -6.20M (-5%)
Q3 2016 92.02M 80.82M -11.20M (-12%)
Q2 2016 77.83M 78.53M +699000 (+1%)
Q1 2016 118.60M 120.93M +2.33M (+2%)
Q4 2015 109.10M 109.14M +40000 (0%)
Q3 2015 67.41M 70.69M +3.28M (+5%)
Q1 2015 82.86M 96.20M +13.34M (+16%)
Q4 2014 95.04M 94.93M -0.11M (-0%)
Q1 2014 65.24M 71.90M +6.66M (+10%)
Q3 2012 38.78M 38.05M -0.73M (-2%)
Q2 2012 36.80M 39.60M +2.80M (+8%)
Quotes delayed 20 minutes

Email EnvelopeFree NLS Email Alerts:
Get Dividend Alerts
Get SEC Filing Alerts
10 Most Oversold S&P 500 Stocks
10 Most Overbought S&P 500 Stocks
10 ETFs With Stocks Insiders Are Buying
10 ETFs With Most Upside To Targets
The DividendRank Top 25
Warren Buffett Dividend Stocks
10 Cheap Dividend Stocks Under $10
10 Top DividendRank'ed Energy Stocks
The 10 Highest Yielding Preferred Stocks
The 15 Most Active S&P Call & Put Options

Next Earnings Date Calendar:

ACM Research (ACMR): 11/7/2023 5:00 AM
Air Products & Chemicals (APD): 11/7/2023 6:00 AM
Evergy (EVRG): 11/7/2023 6:00 AM
Enovis (ENOV): 11/7/2023 6:00 AM
GEO Group (GEO): 11/7/2023 6:00 AM
MultiPlan (MPLN): 11/7/2023 6:00 AM
Triumph Group (TGI): 11/7/2023 6:00 AM
Amneal Pharmaceuticals (AMRX): 11/7/2023 6:00 AM
Vertex Energy (VTNR): 11/7/2023 6:00 AM
Science 37 Hldgs (SNCE): 11/7/2023 6:00 AM

More from the Next Earnings Dates Calendar

Earnings History:

Gold Resource (GORO): 11/6/2023 9:22 PM
Adtran (ADTN): 11/6/2023 6:00 PM
Artesian Resources (ARTNA): 11/6/2023 5:53 PM
Air Transport Services Gr (ATSG): 11/6/2023 5:50 PM
Talos Energy (TALO): 11/6/2023 5:45 PM
Celanese (CE): 11/6/2023 5:26 PM
Hallador Energy (HNRG): 11/6/2023 5:24 PM
SandRidge Energy (SD): 11/6/2023 5:22 PM
Diamond Offshore Drilling (DO): 11/6/2023 5:19 PM
Nine Energy Service (NINE): 11/6/2023 5:15 PM

More from the Earnings History archive
Nautilus (NLS) is categorized under the Consumer sector; to help you further research past earnings across stocks, below are some other companies in the same sector:

NUS Historical Earnings
NUZE Historical Earnings
NWL Historical Earnings
OBCI Historical Earnings
ODC Historical Earnings
OLPX Historical Earnings
OSK Historical Earnings
OXM Historical Earnings
PATK Historical Earnings
PCAR Historical Earnings
On this page we presented the NLS earnings surprises information for Nautilus, comparing the expected earnings versus the actual earnings quarter by quarter, with the resulting positive or negative percentage surprise. Any self directed investor doing their due diligence on NLS (or any other given stock) can benefit from researching all of the Nautilus past earnings going backwards in time, including how often the company beat or missed the market's expectations. To help you with this Nautilus earnings surprise research, on this page we presented each quarter's resulting numbers for easy comparison. Studying these numbers can help an investor by providing important context with which to think about NLS's next earnings report. In your continued research on Nautilus we hope you will be sure to check out the further links included for revenue and earnings history as well as next earnings dates for NLS. Thanks for visiting, and the next time you need to research NLS earnings surprises or those of another stock, we hope you'll think of our site as your go-to earnings surprises research resource of choice.

Recommended: NVR RSI, Top Ten Hedge Funds Holding UPLD, WAAS Videos.


NLS Earnings Surprises | www.NextEarningsDate.com | Copyright © 2020 - 2023, All Rights Reserved

Nothing in NextEarningsDate.com is intended to be investment advice, nor does it represent the opinion of, counsel from, or recommendations by BNK Invest Inc. or any of its affiliates, subsidiaries or partners. None of the information contained herein constitutes a recommendation that any particular security, portfolio, transaction, or investment strategy is suitable for any specific person. All viewers agree that under no circumstances will BNK Invest, Inc,. its subsidiaries, partners, officers, employees, affiliates, or agents be held liable for any loss or damage caused by your reliance on information obtained. By visiting, using or viewing this site, you agree to the following Full Disclaimer & Terms of Use and Privacy Policy. Video widget and market videos powered by Market News Video. Quote and option data delayed at least 15 minutes; stock quote data powered by Ticker Technologies, and Mergent.
X
Wait! Don't leave yet.
Want to receive our latest research absolutely free?


Click the button below for your complimentary copy of Your Early Retirement Portfolio: Dividends Up to 9.5%—Every Month—Forever.

You'll discover the details on 4 stocks and funds that pay you massive dividends as high as 9.5%.