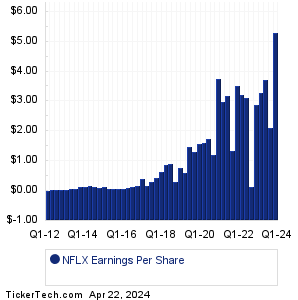
| NFLX Earnings History | |||||||||||||||||||||||||||||||||||||||||||||||||||||||||||||||||||||||||||||||||||||||||||||||||||||||||||||||||||||||||||||||||||||||||||||||||||
|
|
|
| NFLX Earnings History | |||||||||||||||||||||||||||||||||||||||||||||||||||||||||||||||||||||||||||||||||||||||||||||||||||||||||||||||||||||||||||||||||||||||||||||||||||
|
|
|
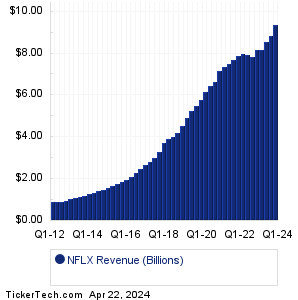
| NFLX Revenue History | |||||||||||||||||||||||||||||||||||||||||||||||||||||||||||||||||||||||||||||||||||||||||||||||||||||||||||||||||||||||||||||||||||||||||||||||||||
|
| NFLX Current Stock Quote |
Get Dividend Alerts Get SEC Filing Alerts |
| NFLX Stock Price Chart |
| Next Earnings Dates |
Next Earnings Date Calendar:Neogen (NEOG): 4/9/2024 7:00 AMGreenidge Generation Hldg (GREE): 4/9/2024 After close Pricesmart (PSMT): 4/9/2024 After close WD-40 (WDFC): 4/9/2024 After close SMART Glb Hldgs (SGH): 4/9/2024 After close Aehr Test Systems (AEHR): 4/9/2024 After close Intensity Therapeutics (INTS): 4/9/2024 After close Delta Air Lines (DAL): 4/10/2024 6:30 AM Applied Digital (APLD): 4/10/2024 8:00 AM Pure Cycle (PCYO): 4/10/2024 After close More from the Next Earnings Dates Calendar Earnings History:CPI Aerostructures (CVU): 4/5/2024 8:40 PMCapStar Finl Hldgs (CSTR): 4/5/2024 5:00 PM Seelos Therapeutics (SEEL): 4/5/2024 After close Greenbrier Companies (GBX): 4/5/2024 8:30 AM Byrna Technologies (BYRN): 4/5/2024 8:00 AM Movano (MOVE): 4/4/2024 After close Kura Sushi USA (KRUS): 4/4/2024 After close Conifer Holdings (CNFR): 4/4/2024 After close Lamb Weston Hldgs (LW): 4/4/2024 8:30 AM Schnitzer Steel (RDUS): 4/4/2024 8:01 AM More from the Earnings History archive |
| Featured Articles |
| Earnings Peers |
| Netflix (NFLX) is categorized under the Services sector; to help you further research past earnings across stocks, below are some other companies in the same sector:
NGVC Past Earnings NVR Past Earnings NWHM Past Earnings NWS Past Earnings NWSA Past Earnings NXPL Past Earnings NXST Past Earnings NYT Past Earnings ODP Past Earnings OLLI Past Earnings |
Recommended: Cal-Maine Foods Past Earnings, NK Options Chain, STT Stock Predictions.
Click the button below for your complimentary copy of Your Early Retirement Portfolio: Dividends Up to 9.5%—Every Month—Forever.
You'll discover the details on 4 stocks and funds that pay you massive dividends as high as 9.5%.