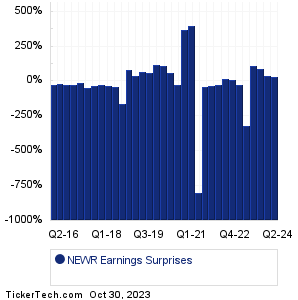
| NEWR Earnings Surprises | ||||||||||||||||||||||||||||||||||||||||||||||||||||||||||||||||||||||||||||||||||||||||||||||||||||||||||||||||||||||||||||||||||||||||
|
|
|
| NEWR Earnings Surprises | ||||||||||||||||||||||||||||||||||||||||||||||||||||||||||||||||||||||||||||||||||||||||||||||||||||||||||||||||||||||||||||||||||||||||
|
|
|
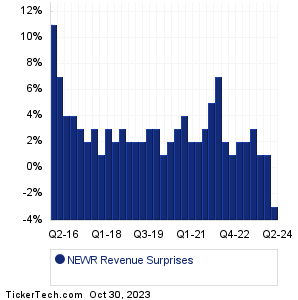
| NEWR Revenue Surprises | ||||||||||||||||||||||||||||||||||||||||||||||||||||||||||||||||||||||||||||||||||||||||||||||||||||||||||||||||||||||||||||||||||||||||
|
| NEWR Current Stock Quote |
Get Dividend Alerts Get SEC Filing Alerts |
| NEWR Stock Price Chart |
| Next Earnings Dates |
Next Earnings Date Calendar:Revvity (RVTY): 10/30/2023 6:00 AMLoews (L): 10/30/2023 6:00 AM XPO (XPO): 10/30/2023 6:00 AM McDonald's (MCD): 10/30/2023 7:00 AM SoFi Techs (SOFI): 10/30/2023 7:00 AM BGC Group (BGC): 10/30/2023 7:00 AM SJW Gr (SJW): 10/30/2023 7:30 AM ON Semiconductor (ON): 10/30/2023 8:00 AM Western Digital (WDC): 10/30/2023 8:00 AM Alexander's (ALX): 10/30/2023 8:00 AM More from the Next Earnings Dates Calendar Earnings History:First Cap (FCAP): 10/27/2023 5:00 PMTerritorial Bancorp (TBNK): 10/27/2023 After close CB Financial Services (CBFV): 10/27/2023 After close NorthEast Community (NECB): 10/27/2023 After close Civista Bancshares (CIVB): 10/27/2023 8:30 AM Standard Motor Products (SMP): 10/27/2023 8:30 AM Arbor Realty Trust (ABR): 10/27/2023 8:15 AM Cumulus Media (CMLS): 10/27/2023 8:00 AM First Hawaiian (FHB): 10/27/2023 8:00 AM Piper Sandler (PIPR): 10/27/2023 8:00 AM More from the Earnings History archive |
| Earnings Peers |
| New Relic (NEWR) is categorized under the Technology sector; to help you further research past earnings across stocks, below are some other companies in the same sector:
NH Historical Earnings NLOK Historical Earnings NOW Historical Earnings NPTN Historical Earnings NRDY Historical Earnings NSIT Historical Earnings NSSC Historical Earnings NTAP Historical Earnings NTCT Historical Earnings NTGR Historical Earnings |
Recommended: DOCS YTD Return, Institutional Holders of SVII, BOMH Insider Buying.
Click the button below for your complimentary copy of Your Early Retirement Portfolio: Dividends Up to 8.1%—Every Month—Forever.
You'll discover the details on 4 stocks and funds that pay you massive dividends as high as 8.1%.