NAT Earnings Surprises image   This NAT earnings surprises page last updated 11/25/2021
NAT Earnings Surprises Chart
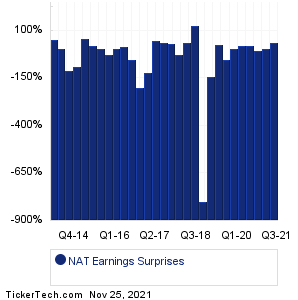
Data adjusted for NAT split history

PeriodExpectedActualSurprise
Q3 2021 -0.16 -0.22 -0.06 (+38%)
Q2 2021 -0.17 -0.18 -0.01 (+6%)
Q1 2021 -0.17 -0.16 +0.01 (-6%)
Q4 2020 -0.16 -0.19 -0.03 (+19%)
Q2 2020 0.28 0.33 +0.05 (+18%)
Q1 2020 0.26 0.27 +0.01 (+4%)
Q4 2019 0.20 0.09 -0.11 (-55%)
Q3 2019 -0.08 -0.10 -0.02 (+25%)
Q1 2019 -0.09 0.04 +0.13 (-144%)
Q4 2018 0.01 -0.07 -0.08 (-800%)
Q3 2018 -0.12 -0.27 -0.15 (+125%)
Q2 2018 -0.14 -0.19 -0.05 (+36%)
Q1 2018 -0.18 -0.13 +0.05 (-28%)
Q4 2017 -0.15 -0.20 -0.05 (+33%)
Q3 2017 -0.25 -0.34 -0.09 (+36%)
Q2 2017 -0.11 -0.16 -0.05 (+45%)
Q1 2017 0.05 -0.01 -0.06 (-120%)
Q4 2016 0.02 -0.02 -0.04 (-200%)
Q3 2016 -0.17 -0.08 +0.09 (-53%)
Q2 2016 0.13 0.15 +0.02 (+15%)
Q1 2016 0.31 0.33 +0.02 (+6%)
Q4 2015 0.46 0.34 -0.12 (-26%)
Q3 2015 0.27 0.29 +0.02 (+7%)
Q2 2015 0.29 0.35 +0.06 (+21%)
Q1 2015 0.22 0.34 +0.12 (+55%)
Q4 2014 0.09 0.01 -0.08 (-89%)
Q3 2014 -0.11 0.01 +0.12 (-109%)
Q2 2014 -0.18 -0.19 -0.01 (+6%)
Q1 2013 -0.28 -0.42 -0.15 (+50%)
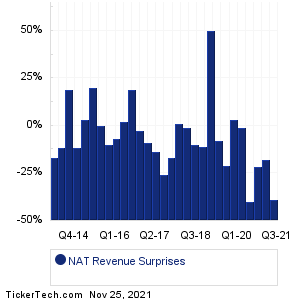
NAT Revenue Surprises Chart
PeriodExpectedActualSurprise
Q3 2021 15.29M 9.31M -5.98M (-39%)
Q2 2021 20.32M 16.75M -3.57M (-18%)
Q1 2021 24.23M 18.81M -5.42M (-22%)
Q4 2020 27.12M 16.29M -10.83M (-40%)
Q2 2020 94.35M 93.77M -0.58M (-1%)
Q1 2020 83.32M 86.18M +2.86M (+3%)
Q4 2019 74.21M 58.82M -15.39M (-21%)
Q3 2019 35.18M 32.35M -2.83M (-8%)
Q1 2019 35.88M 53.93M +18.05M (+50%)
Q4 2018 49.56M 44.19M -5.37M (-11%)
Q3 2018 25.73M 23.19M -2.54M (-10%)
Q2 2018 27.23M 27.01M -0.22M (-1%)
Q1 2018 29.32M 29.62M +296000 (+1%)
Q4 2017 44.46M 36.72M -7.74M (-17%)
Q3 2017 32.05M 23.67M -8.38M (-26%)
Q2 2017 45.26M 39.09M -6.17M (-14%)
Q1 2017 60.49M 55.20M -5.29M (-9%)
Q4 2016 53.91M 52.54M -1.37M (-3%)
Q3 2016 38.45M 45.86M +7.41M (+19%)
Q2 2016 60.55M 61.65M +1.10M (+2%)
Q1 2016 82.80M 76.73M -6.07M (-7%)
Q4 2015 86.42M 77.39M -9.04M (-10%)
Q3 2015 66.59M 66.67M +83000 (0%)
Q2 2015 61.21M 73.46M +12.25M (+20%)
Q1 2015 67.29M 69.56M +2.27M (+3%)
Q4 2014 48.89M 43.07M -5.82M (-12%)
Q3 2014 34.29M 40.91M +6.62M (+19%)
Q2 2014 25.84M 22.62M -3.22M (-12%)
Q1 2013 20.77M 17.30M -3.47M (-17%)
Quotes delayed 20 minutes

Email EnvelopeFree NAT Email Alerts:
Get Dividend Alerts
Get SEC Filing Alerts
10 Most Oversold S&P 500 Stocks
10 Most Overbought S&P 500 Stocks
10 ETFs With Stocks Insiders Are Buying
10 ETFs With Most Upside To Targets
The DividendRank Top 25
Warren Buffett Dividend Stocks
10 Cheap Dividend Stocks Under $10
10 Top DividendRank'ed Energy Stocks
The 10 Highest Yielding Preferred Stocks
The 15 Most Active S&P Call & Put Options

Next Earnings Date Calendar:

Driven Brands Holdings (DRVN): 11/25/2021 2:59 AM
CarLotz (LOTZ): 11/25/2021 3:39 AM
Shoals Technologies (SHLS): 11/25/2021 3:47 AM
Ortho Clinical Diagnostic (OCDX): 11/25/2021 4:02 AM
Qualtrics International (XM): 11/25/2021 4:07 AM
The L S Starrett (SCX): 11/26/2021 3:00 AM
VirnetX Holding (VHC): 11/26/2021 9:33 AM
Inovalon Holdings (INOV): 11/26/2021 After close
CAI International (CAI): 11/26/2021 After close
Snap One Holdings (SNPO): 11/26/2021 After close

More from the Next Earnings Dates Calendar

Earnings History:

Aura Biosciences (AURA): 11/24/2021 5:42 PM
Motorsport Games (MSGM): 11/24/2021 9:28 AM
Aligos Therapeutics (ALGS): 11/24/2021 8:00 AM
Nordic American Tankers (NAT): 11/24/2021 7:00 AM
Ingles Markets (IMKTA): 11/24/2021 7:00 AM
Anavex Life Sciences (AVXL): 11/24/2021 7:00 AM
Deere (DE): 11/24/2021 6:05 AM
Sound Financial Bancorp (SFBC): 11/23/2021 8:00 PM
Guess? (GES): 11/23/2021 After close
Gap (GPS): 11/23/2021 After close

More from the Earnings History archive
Nordic American Tankers (NAT) is categorized under the Energy sector; to help you further research past earnings across stocks, below are some other companies in the same sector:

NCSM Past Earnings
NE Past Earnings
NEX Past Earnings
NEXT Past Earnings
NGS Past Earnings
NINE Past Earnings
NOV Past Earnings
NR Past Earnings
OAS Past Earnings
OEC Past Earnings
On this page we presented the NAT earnings surprises information for Nordic American Tankers, comparing the expected earnings versus the actual earnings quarter by quarter, with the resulting positive or negative percentage surprise. Any self directed investor doing their due diligence on NAT (or any other given stock) can benefit from researching all of the Nordic American Tankers past earnings going backwards in time, including how often the company beat or missed the market's expectations. To help you with this Nordic American Tankers earnings surprise research, on this page we presented each quarter's resulting numbers for easy comparison. Studying these numbers can help an investor by providing important context with which to think about NAT's next earnings report. In your continued research on Nordic American Tankers we hope you will be sure to check out the further links included for revenue and earnings history as well as next earnings dates for NAT. Thanks for visiting, and the next time you need to research NAT earnings surprises or those of another stock, we hope you'll think of our site as your go-to earnings surprises research resource of choice.
 

NAT Earnings Surprises | www.NextEarningsDate.com | Copyright © 2020 - 2021, All Rights Reserved

Nothing in NextEarningsDate.com is intended to be investment advice, nor does it represent the opinion of, counsel from, or recommendations by BNK Invest Inc. or any of its affiliates, subsidiaries or partners. None of the information contained herein constitutes a recommendation that any particular security, portfolio, transaction, or investment strategy is suitable for any specific person. All viewers agree that under no circumstances will BNK Invest, Inc,. its subsidiaries, partners, officers, employees, affiliates, or agents be held liable for any loss or damage caused by your reliance on information obtained. By visiting, using or viewing this site, you agree to the following Full Disclaimer & Terms of Use and Privacy Policy. Video widget and market videos powered by Market News Video. Quote and option data delayed at least 15 minutes; stock quote data powered by Ticker Technologies, and Mergent.