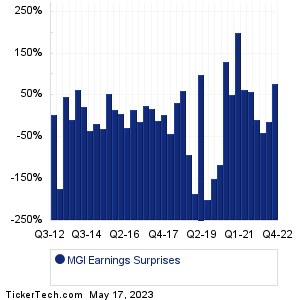
| MoneyGram Int Earnings Surprises | ||||||||||||||||||||||||||||||||||||||||||||||||||||||||||||||||||||||||||||||||||||||||||||||||||||||||||||||||||||||||||||||||||||||||||||||||||||||||
|
|
|
| MoneyGram Int Earnings Surprises | ||||||||||||||||||||||||||||||||||||||||||||||||||||||||||||||||||||||||||||||||||||||||||||||||||||||||||||||||||||||||||||||||||||||||||||||||||||||||
|
|
|
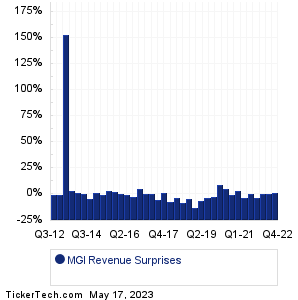
| MGI Revenue Surprises | ||||||||||||||||||||||||||||||||||||||||||||||||||||||||||||||||||||||||||||||||||||||||||||||||||||||||||||||||||||||||||||||||||||||||||||||||||||||||
|
| MGI Current Stock Quote |
Get Dividend Alerts Get SEC Filing Alerts |
| MGI Stock Price Chart |
| Next Earnings Dates |
Next Earnings Date Calendar:Sidus Space (SIDU): 4/4/2023 3:00 AMAcuity Brands (AYI): 4/4/2023 6:00 AM MSC Industrial Direct Co (MSM): 4/4/2023 6:30 AM Lindsay (LNN): 4/4/2023 6:45 AM Kirkland's (KIRK): 4/4/2023 7:00 AM HF Foods Group (HFFG): 4/4/2023 8:00 AM AgEagle Aerial Sys (UAVS): 4/4/2023 8:30 AM SMART Global Holdings (SGH): 4/4/2023 After close Resources Connection (RGP): 4/4/2023 After close Kura Sushi USA (KRUS): 4/4/2023 After close More from the Next Earnings Dates Calendar Earnings History:Exela Technologies (XELA): 4/3/2023 After closeSecurity National Finl (SNFCA): 4/3/2023 10:37 AM Fresh Vine Wine (VINE): 4/3/2023 9:41 AM Reading Intl (RDI): 4/3/2023 9:00 AM BTCS (BTCS): 4/3/2023 8:35 AM Jupiter Wellness (JUPW): 4/3/2023 8:30 AM Stryve Foods (SNAX): 4/3/2023 8:15 AM Digital Ally (DGLY): 4/3/2023 8:00 AM Vaccinex (VCNX): 4/3/2023 8:00 AM OncoCyte (OCX): 4/3/2023 8:00 AM More from the Earnings History archive |
| Earnings Peers |
| MoneyGram Int (MGI) is categorized under the Industrials sector; to help you further research past earnings across stocks, below are some other companies in the same sector:
MGRC Historical Earnings MICT Historical Earnings MIDD Historical Earnings MLHR Historical Earnings MLI Historical Earnings MLKN Historical Earnings MMS Historical Earnings MNTX Historical Earnings MPLN Historical Earnings MRAI Historical Earnings |
Recommended: NVCT Videos, GAMB YTD Return, TIGR Historical Stock Prices.