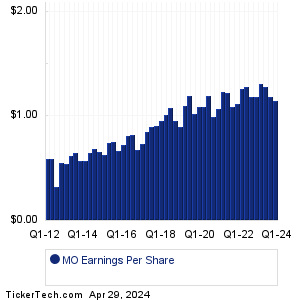
MO Earnings History image   This MO earnings history page last updated 4/29/2024
MO Earnings History Chart
PeriodEarnings DateAdj. EPS
Q1 20244/25/20241.150
Q4 20232/1/20241.180
Q3 202310/26/20231.280
Q2 20238/1/20231.310
Q1 20234/27/20231.180
Q4 20222/1/20231.180
Q3 202210/27/20221.280
Q2 20227/28/20221.260
Q1 20224/28/20221.120
Q4 20211/27/20221.090
Q3 202110/28/20211.220
Q2 20217/29/20211.230
Q1 20214/29/20211.070
Q4 20201/28/20210.990
Q3 202010/30/20201.190
Q2 20207/28/20201.090
Q1 20204/30/20201.090
Q4 20191/30/20201.020
Q3 201910/31/20191.190
Q2 20197/30/20191.100
Q1 20194/25/20190.900
Q4 20181/31/20190.95
Q3 201810/25/20181.08
Q2 20187/26/20181.01
Q1 20184/26/20180.95
Q4 20172/1/20180.91
Q3 201710/26/20170.9
Q2 20177/27/20170.85
Q1 20175/2/20170.73
Q4 20162/1/20170.68
Q3 201610/27/20160.82
Q2 20167/27/20160.81
Q1 20164/28/20160.72
Q4 20151/28/20160.67
Q3 201510/29/20150.75
Q2 20157/29/20150.74
Q1 20154/23/20150.63
Q4 20141/30/20150.66
Q3 201410/30/20140.69
Q2 20147/22/20140.65
Q1 20144/24/20140.57
Q4 20131/30/20140.57
Q3 201310/24/20130.65
Q2 20137/23/20130.62
Q1 20134/25/20130.54
Q4 20121/31/20130.55
Q3 201210/25/20120.32
Q2 20127/24/20120.59
Q1 20124/24/20120.59
MO Revenue History Chart
PeriodEarnings DateGAAP
Q1 20244/25/20245.58B
Q4 20232/1/20245.02B
Q3 202310/26/20235.28B
Q2 20238/1/20235.44B
Q1 20234/27/20234.76B
Q4 20222/1/20235.08B
Q3 202210/27/20225.88B
Q2 20227/28/20225.37B
Q1 20224/28/20224.82B
Q4 20211/27/20225.09B
Q3 202110/28/20215.53B
Q2 20217/29/20215.61B
Q1 20214/29/20214.88B
Q4 20201/28/20215.05B
Q3 202010/30/20205.68B
Q2 20207/28/20205.06B
Q1 20204/30/20204.33B
Q4 20191/30/20204.80B
Q3 201910/31/20195.41B
Q2 20197/30/20195.19B
Q1 20194/25/20194.39B
Q4 20181/31/20194.79B
Q3 201810/25/20185.29B
Q2 20187/26/20184.88B
Q1 20184/26/20184.67B
Q4 20172/1/20184.71B
Q3 201710/26/20175.12B
Q2 20177/27/20175.07B
Q1 20175/2/20174.59B
Q4 20162/1/20174.73B
Q3 201610/27/20165.19B
Q2 20167/27/20164.88B
Q1 20164/28/20164.53B
Q4 20151/28/20164.73B
Q3 201510/29/20154.98B
Q2 20157/29/20154.88B
Q1 20154/23/20154.27B
Q4 20141/30/20154.61B
Q3 201410/30/20144.75B
Q2 20147/22/20144.60B
Q1 20144/24/20144.01B
Q4 20131/30/20144.40B
Q3 201310/24/20136.55B
Q2 20137/23/20136.30B
Q1 20134/25/20135.50B
Q4 20121/31/20136.20B
Q3 201210/25/20126.24B
Q2 20127/24/20126.49B
Q1 20124/24/20125.65B
Quotes delayed 20 minutes

Email EnvelopeFree MO Email Alerts:
Get Dividend Alerts
Get SEC Filing Alerts
10 Most Oversold S&P 500 Stocks
10 Most Overbought S&P 500 Stocks
10 ETFs With Stocks Insiders Are Buying
10 ETFs With Most Upside To Targets
The DividendRank Top 25
Warren Buffett Dividend Stocks
10 Cheap Dividend Stocks Under $10
10 Top DividendRank'ed Energy Stocks
The 10 Highest Yielding Preferred Stocks
The 15 Most Active S&P Call & Put Options

Next Earnings Date Calendar:

Revvity (RVTY): 4/29/2024 6:00 AM
Provident Finl Hldgs (PROV): 4/29/2024 6:00 AM
Hyzon Motors (HYZN): 4/29/2024 6:00 AM
Hope Bancorp (HOPE): 4/29/2024 6:00 AM
Domino's Pizza (DPZ): 4/29/2024 7:00 AM
SoFi Techs (SOFI): 4/29/2024 7:00 AM
HNI (HNI): 4/29/2024 7:30 AM
ON Semiconductor (ON): 4/29/2024 8:00 AM
Franklin Resources (BEN): 4/29/2024 8:30 AM
Bank of Marin (BMRC): 4/29/2024 8:30 AM

More from the Next Earnings Dates Calendar

Earnings History:

First Cap (FCAP): 4/26/2024 After close
Bank of the James Finl Gr (BOTJ): 4/26/2024 12:00 PM
Meridian (MRBK): 4/26/2024 10:42 AM
Perma-Pipe Inlt Hldgs (PPIH): 4/26/2024 9:26 AM
Oppenheimer Hldgs (OPY): 4/26/2024 9:20 AM
Tompkins Finl (TMP): 4/26/2024 9:00 AM
Glen Burnie Bancorp (GLBZ): 4/26/2024 8:59 AM
Village Bank & Trust Finl (VBFC): 4/26/2024 8:45 AM
Burke & Herbert Financial (BHRB): 4/26/2024 8:30 AM
First Hawaiian (FHB): 4/26/2024 8:00 AM

More from the Earnings History archive
Altria Group (MO) is categorized under the Consumer sector; to help you further research past earnings across stocks, below are some other companies in the same sector:

MOD Past Earnings
MODG Past Earnings
MOV Past Earnings
MPAA Past Earnings
MPX Past Earnings
MTEX Past Earnings
MTOR Past Earnings
MULN Past Earnings
NAII Past Earnings
NAPA Past Earnings
On this page we presented the MO earnings and revenue history archive for Altria Group, comparing the historical top line revenue performance quarter by quarter, as well as the MO earnings per share history. Any self directed investor doing their due diligence on MO (or any other given stock) can benefit from researching all of the Altria Group past earnings and revenue results going backwards in time, and to help you with this Altria Group earnings history research, on this page we presented each quarter's resulting numbers in both table and graphical form for easy comparison. Studying these numbers can help an investor by providing important context with which to think about MO's next earnings report. In your continued research on Altria Group we hope you will be sure to check out the further links included for earnings surprises as well as next earnings dates for MO. Thanks for visiting, and the next time you need to research MO earnings history (or the earnings history of another stock), we hope you'll think of our site as your go-to earnings history research resource of choice.

Recommended: CHGG Historical Stock Prices, Funds Holding LCR, EWCZ Insider Buying.


MO Earnings History | www.NextEarningsDate.com | Copyright © 2020 - 2024, All Rights Reserved

Nothing in NextEarningsDate.com is intended to be investment advice, nor does it represent the opinion of, counsel from, or recommendations by BNK Invest Inc. or any of its affiliates, subsidiaries or partners. None of the information contained herein constitutes a recommendation that any particular security, portfolio, transaction, or investment strategy is suitable for any specific person. All viewers agree that under no circumstances will BNK Invest, Inc,. its subsidiaries, partners, officers, employees, affiliates, or agents be held liable for any loss or damage caused by your reliance on information obtained. By visiting, using or viewing this site, you agree to the following Full Disclaimer & Terms of Use and Privacy Policy. Video widget and market videos powered by Market News Video. Quote and option data delayed at least 15 minutes; stock quote data powered by Ticker Technologies, and Mergent.
X
Wait! Don't leave yet.
Want to receive our latest research absolutely free?


Click the button below for your complimentary copy of Your Early Retirement Portfolio: Dividends Up to 8.7%—Every Month—Forever.

You'll discover the details on 4 stocks and funds that pay you massive dividends as high as 8.7%.