MIC Earnings Surprises image   This MIC earnings surprises page last updated 11/9/2021
MIC Earnings Surprises Chart
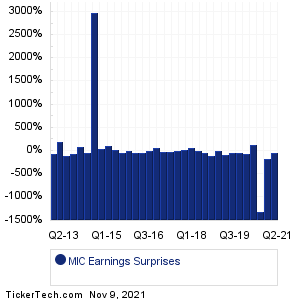
Data adjusted for MIC split history

PeriodExpectedActualSurprise
Q2 2021 0.12 0.08 -0.04 (-33%)
Q4 2020 0.27 -0.18 -0.45 (-167%)
Q3 2020 0.15 -1.82 -1.97 (-1313%)
Q2 2020 -0.04 -0.09 -0.05 (+125%)
Q1 2020 0.31 0.13 -0.18 (-58%)
Q4 2019 0.29 0.18 -0.11 (-38%)
Q3 2019 0.36 0.18 -0.18 (-50%)
Q2 2019 0.36 0.07 -0.29 (-81%)
Q1 2019 0.71 0.73 +0.02 (+3%)
Q4 2018 0.33 -0.01 -0.34 (-103%)
Q3 2018 0.51 0.28 -0.23 (-45%)
Q2 2018 0.44 0.45 +0.01 (+2%)
Q1 2018 0.53 0.88 +0.35 (+66%)
Q4 2017 0.51 0.59 +0.08 (+16%)
Q3 2017 0.54 0.48 -0.06 (-11%)
Q2 2017 0.50 0.37 -0.13 (-26%)
Q1 2017 0.51 0.44 -0.07 (-14%)
Q4 2016 0.53 0.89 +0.36 (+68%)
Q3 2016 0.47 0.51 +0.04 (+9%)
Q2 2016 0.45 0.24 -0.21 (-47%)
Q1 2016 0.47 0.28 -0.19 (-40%)
Q4 2015 0.34 0.35 +0.01 (+3%)
Q3 2015 0.23 0.13 -0.10 (-43%)
Q2 2015 0.35 0.45 +0.10 (+29%)
Q1 2015 -0.56 -1.22 -0.66 (+118%)
Q4 2014 0.22 0.32 +0.10 (+45%)
Q3 2014 0.45 13.87 +13.42 (+2982%)
Q2 2014 0.36 0.17 -0.19 (-53%)
Q4 2013 0.33 0.61 +0.28 (+85%)
Q3 2013 0.44 0.20 -0.24 (-55%)
Q2 2013 0.42 -0.02 -0.44 (-105%)
Q1 2013 0.04 0.12 +0.08 (+200%)
Q2 2012 0.78 0.24 -0.54 (-69%)
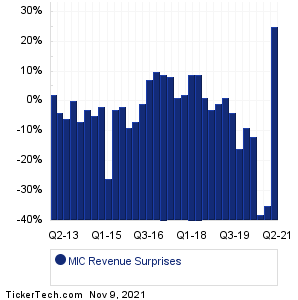
MIC Revenue Surprises Chart
PeriodExpectedActualSurprise
Q2 2021 231.60M 288.78M +57.18M (+25%)
Q4 2020 339.40M 220.00M -0.12B (-35%)
Q3 2020 325.50M 202.00M -0.12B (-38%)
Q2 2020 295.70M 261.00M -34.70M (-12%)
Q1 2020 457.60M 416.00M -41.60M (-9%)
Q4 2019 502.12M 424.00M -78.12M (-16%)
Q3 2019 422.20M 405.00M -17.20M (-4%)
Q2 2019 412.30M 416.00M +3.70M (+1%)
Q1 2019 488.00M 482.00M -6.00M (-1%)
Q4 2018 453.40M 437.76M -15.64M (-3%)
Q3 2018 466.56M 473.28M +6.72M (+1%)
Q2 2018 439.33M 478.08M +38.75M (+9%)
Q1 2018 461.52M 501.56M +40.04M (+9%)
Q4 2017 460.30M 471.20M +10.90M (+2%)
Q3 2017 447.58M 453.06M +5.48M (+1%)
Q2 2017 406.22M 438.99M +32.77M (+8%)
Q1 2017 412.39M 451.46M +39.07M (+9%)
Q4 2016 397.69M 437.24M +39.55M (+10%)
Q3 2016 393.90M 420.52M +26.62M (+7%)
Q2 2016 399.95M 397.58M -2.37M (-1%)
Q1 2016 424.67M 396.39M -28.28M (-7%)
Q4 2015 439.81M 401.35M -38.46M (-9%)
Q3 2015 425.92M 415.71M -10.21M (-2%)
Q2 2015 437.25M 423.69M -13.56M (-3%)
Q1 2015 442.49M 326.00M -0.12B (-26%)
Q4 2014 412.04M 405.14M -6.90M (-2%)
Q3 2014 408.85M 388.60M -20.25M (-5%)
Q2 2014 289.81M 280.90M -8.91M (-3%)
Q4 2013 280.35M 260.53M -19.82M (-7%)
Q3 2013 263.70M 263.72M +19000 (0%)
Q2 2013 269.03M 252.60M -16.43M (-6%)
Q1 2013 274.56M 264.20M -10.36M (-4%)
Q2 2012 253.94M 258.50M +4.56M (+2%)
Quotes delayed 20 minutes

Email EnvelopeFree MIC Email Alerts:
Get Dividend Alerts
Get SEC Filing Alerts
10 Most Oversold S&P 500 Stocks
10 Most Overbought S&P 500 Stocks
10 ETFs With Stocks Insiders Are Buying
10 ETFs With Most Upside To Targets
The DividendRank Top 25
Warren Buffett Dividend Stocks
10 Cheap Dividend Stocks Under $10
10 Top DividendRank'ed Energy Stocks
The 10 Highest Yielding Preferred Stocks
The 15 Most Active S&P Call & Put Options

Next Earnings Date Calendar:

Haemonetics (HAE): 11/9/2021 6:00 AM
Triumph Group (TGI): 11/9/2021 6:00 AM
EchoStar (SATS): 11/9/2021 6:00 AM
Party City Holdco (PRTY): 11/9/2021 6:00 AM
Mersana Therapeutics (MRSN): 11/9/2021 6:00 AM
UWM Holdings (UWMC): 11/9/2021 6:00 AM
Vertex Energy (VTNR): 11/9/2021 6:00 AM
D.R. Horton (DHI): 11/9/2021 6:30 AM
WRKCo (WRK): 11/9/2021 6:30 AM
SeaWorld Entertainment (SEAS): 11/9/2021 6:30 AM

More from the Next Earnings Dates Calendar

Earnings History:

Mueller Water Products (MWA): 11/8/2021 5:00 PM
Lemonade (LMND): 11/8/2021 5:00 PM
Day One Biopharmaceutical (DAWN): 11/8/2021 After close
Pennant Group (PNTG): 11/8/2021 After close
Eliem Therapeutics (ELYM): 11/8/2021 After close
Akerna (KERN): 11/8/2021 After close
Battalion Oil (BATL): 11/8/2021 After close
Northwest Pipe (NWPX): 11/8/2021 After close
Global Water Resources (GWRS): 11/8/2021 After close
Granite Point Mortgage (GPMT): 11/8/2021 After close

More from the Earnings History archive
Macquarie Infrastructure (MIC) is categorized under the Industrials sector; to help you further research past earnings across stocks, below are some other companies in the same sector:

MIDD Past Earnings
MLHR Past Earnings
MLI Past Earnings
MMS Past Earnings
MNTX Past Earnings
MPLN Past Earnings
MRC Past Earnings
MRTN Past Earnings
MSA Past Earnings
MSCI Past Earnings
On this page we presented the MIC earnings surprises information for Macquarie Infrastructure, comparing the expected earnings versus the actual earnings quarter by quarter, with the resulting positive or negative percentage surprise. Any self directed investor doing their due diligence on MIC (or any other given stock) can benefit from researching all of the Macquarie Infrastructure past earnings going backwards in time, including how often the company beat or missed the market's expectations. To help you with this Macquarie Infrastructure earnings surprise research, on this page we presented each quarter's resulting numbers for easy comparison. Studying these numbers can help an investor by providing important context with which to think about MIC's next earnings report. In your continued research on Macquarie Infrastructure we hope you will be sure to check out the further links included for revenue and earnings history as well as next earnings dates for MIC. Thanks for visiting, and the next time you need to research MIC earnings surprises or those of another stock, we hope you'll think of our site as your go-to earnings surprises research resource of choice.
 

MIC Earnings Surprises | www.NextEarningsDate.com | Copyright © 2020 - 2021, All Rights Reserved

Nothing in NextEarningsDate.com is intended to be investment advice, nor does it represent the opinion of, counsel from, or recommendations by BNK Invest Inc. or any of its affiliates, subsidiaries or partners. None of the information contained herein constitutes a recommendation that any particular security, portfolio, transaction, or investment strategy is suitable for any specific person. All viewers agree that under no circumstances will BNK Invest, Inc,. its subsidiaries, partners, officers, employees, affiliates, or agents be held liable for any loss or damage caused by your reliance on information obtained. By visiting, using or viewing this site, you agree to the following Full Disclaimer & Terms of Use and Privacy Policy. Video widget and market videos powered by Market News Video. Quote and option data delayed at least 15 minutes; stock quote data powered by Ticker Technologies, and Mergent.