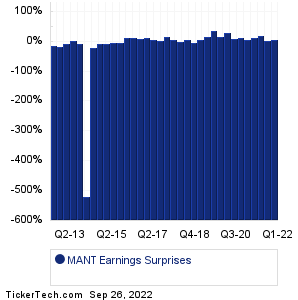
| Mantech Intl Earnings Surprises | ||||||||||||||||||||||||||||||||||||||||||||||||||||||||||||||||||||||||||||||||||||||||||||||||||||||||||||||||||||||||||||||||||||||||||||
|
|
|
| Mantech Intl Earnings Surprises | ||||||||||||||||||||||||||||||||||||||||||||||||||||||||||||||||||||||||||||||||||||||||||||||||||||||||||||||||||||||||||||||||||||||||||||
|
|
|
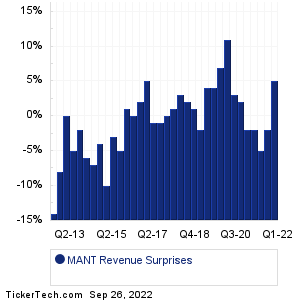
| MANT Revenue Surprises | ||||||||||||||||||||||||||||||||||||||||||||||||||||||||||||||||||||||||||||||||||||||||||||||||||||||||||||||||||||||||||||||||||||||||||||
|
| MANT Current Stock Quote |
Get Dividend Alerts Get SEC Filing Alerts |
| MANT Stock Price Chart |
| Next Earnings Dates |
Next Earnings Date Calendar:United Natural Foods (UNFI): 9/27/2022 6:45 AMSynnex (SNX): 9/27/2022 7:05 AM Jabil (JBL): 9/27/2022 7:30 AM Cracker Barrel Old (CBRL): 9/27/2022 8:00 AM Netsol Technologies (NTWK): 9/27/2022 8:00 AM NewAge (NBEV): 9/27/2022 8:00 AM Aytu BioPharma (AYTU): 9/27/2022 After close Cal-Maine Foods (CALM): 9/27/2022 After close iPower (IPW): 9/27/2022 After close Progress Software (PRGS): 9/27/2022 After close More from the Next Earnings Dates Calendar Earnings History:Rave Restaurant Group (RAVE): 9/23/2022 9:00 AMTrio-Tech Intl (TRT): 9/23/2022 8:30 AM Moving iMage Technologies (MITQ): 9/23/2022 7:00 AM Tuesday Morning (TUEM): 9/23/2022 7:00 AM Backblaze (BLZE): 9/22/2022 5:34 PM Costco Wholesale (COST): 9/22/2022 After close Research Solutions (RSSS): 9/22/2022 After close CalAmp (CAMP): 9/22/2022 After close AAR (AIR): 9/22/2022 After close FedEx (FDX): 9/22/2022 After close More from the Earnings History archive |
| Earnings Peers |
| Mantech Intl (MANT) is categorized under the Industrials sector; to help you further research past earnings across stocks, below are some other companies in the same sector:
MATW Historical Earnings MATX Historical Earnings MCHX Historical Earnings MCO Historical Earnings MDU Historical Earnings MEC Historical Earnings MEG Historical Earnings MEI Historical Earnings MESA Historical Earnings MG Historical Earnings |