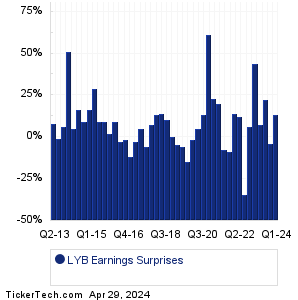
LYB Earnings Surprises image   This LYB earnings surprises page last updated 7/7/2026

LYB Earnings Surprises

— Recent and historical earnings surprises for LyondellBasell Industries (LYB) from Q1 2013 to Q1 2026. The percentage surprise is calculated by comparing the actual reported earnings for the period, against the consensus analyst estimates ahead of the earnings report. The same calculation is also performed for revenue. This history of earnings surprises provide a great way to assess whether the company has a tendency to outperform or underperform expectations.
LYB Earnings Surprises Chart
PeriodExpectedActualSurprise
Q1 2026 0.28 0.49 +0.21 (+75%)
Q4 2025 0.22 -0.26 -0.48 (-218%)
Q3 2025 0.80 1.01 +0.21 (+26%)
Q2 2025 0.85 0.62 -0.23 (-27%)
Q1 2025 0.43 0.33 -0.10 (-23%)
Q4 2024 0.70 0.75 +0.05 (+7%)
Q3 2024 1.98 1.88 -0.10 (-5%)
Q2 2024 2.27 2.24 -0.03 (-1%)
Q1 2024 1.36 1.53 +0.17 (+13%)
Q4 2023 1.31 1.26 -0.05 (-4%)
Q3 2023 2.02 2.46 +0.44 (+22%)
Q2 2023 2.29 2.44 +0.15 (+7%)
Q1 2023 1.74 2.50 +0.76 (+44%)
Q4 2022 1.22 1.29 +0.07 (+6%)
Q3 2022 3.02 1.96 -1.06 (-35%)
Q2 2022 4.63 5.19 +0.56 (+12%)
Q1 2022 3.52 4.00 +0.48 (+14%)
Q4 2021 3.97 3.63 -0.34 (-9%)
Q3 2021 5.69 5.25 -0.44 (-8%)
Q2 2021 5.11 6.13 +1.02 (+20%)
Q1 2021 2.59 3.18 +0.59 (+23%)
Q4 2020 1.36 2.19 +0.83 (+61%)
Q3 2020 1.12 1.27 +0.15 (+13%)
Q2 2020 0.65 0.68 +0.03 (+5%)
Q1 2020 1.50 1.47 -0.03 (-2%)
Q4 2019 2.25 1.92 -0.33 (-15%)
Q3 2019 2.76 2.60 -0.16 (-6%)
Q2 2019 2.83 2.70 -0.13 (-5%)
Q1 2019 2.20 2.19 -0.01 (-0%)
Q3 2018 2.69 2.96 +0.27 (+10%)
Q2 2018 2.93 3.34 +0.41 (+14%)
Q1 2018 2.75 3.11 +0.36 (+13%)
Q4 2017 2.55 2.73 +0.18 (+7%)
Q3 2017 2.57 2.41 -0.16 (-6%)
Q2 2017 2.69 2.82 +0.13 (+5%)
Q1 2017 2.34 2.26 -0.08 (-3%)
Q4 2016 2.21 1.94 -0.27 (-12%)
Q3 2016 2.35 2.31 -0.04 (-2%)
Q2 2016 2.53 2.45 -0.08 (-3%)
Q1 2016 2.28 2.48 +0.20 (+9%)
Q4 2015 2.15 2.20 +0.05 (+2%)
Q3 2015 2.58 2.80 +0.23 (+9%)
Q2 2015 2.57 2.79 +0.22 (+9%)
Q1 2015 1.97 2.54 +0.57 (+29%)
Q4 2014 2.14 2.48 +0.34 (+16%)
Q3 2014 2.30 2.51 +0.21 (+9%)
Q2 2014 1.92 2.22 +0.30 (+16%)
Q1 2014 1.73 1.81 +0.08 (+5%)
Q4 2013 1.40 2.11 +0.71 (+51%)
Q3 2013 1.42 1.51 +0.09 (+6%)
Q2 2013 1.62 1.60 -0.02 (-1%)
Q1 2013 1.45 1.56 +0.11 (+8%)
LYB Revenue Surprises Chart
PeriodExpectedActualSurprise
Q1 2026 7.40B 7.20B -0.21B (-3%)
Q4 2025 6.88B 7.09B +209.82M (+3%)
Q3 2025 7.43B 7.73B +298.40M (+4%)
Q2 2025 7.47B 7.66B +188.92M (+3%)
Q1 2025 7.46B 7.68B +217.00M (+3%)
Q4 2024 9.26B 9.50B +237.00M (+3%)
Q3 2024 10.60B 10.32B -0.28B (-3%)
Q2 2024 10.47B 10.56B +88.00M (+1%)
Q1 2024 9.73B 9.93B +195.00M (+2%)
Q4 2023 9.84B 9.93B +89.00M (+1%)
Q3 2023 10.10B 10.62B +525.00M (+5%)
Q2 2023 10.40B 10.31B -90.00M (-1%)
Q1 2023 10.78B 10.25B -0.53B (-5%)
Q4 2022 10.71B 10.21B -0.50B (-5%)
Q3 2022 12.85B 12.25B -0.60B (-5%)
Q2 2022 13.72B 14.84B +1.12B (+8%)
Q1 2022 12.51B 13.16B +647.00M (+5%)
Q4 2021 11.95B 12.83B +880.00M (+7%)
Q3 2021 11.12B 12.70B +1.58B (+14%)
Q2 2021 10.74B 11.56B +821.00M (+8%)
Q1 2021 9.09B 9.08B -8.00M (-0%)
Q4 2020 7.03B 7.94B +907.00M (+13%)
Q3 2020 6.73B 6.78B +46.00M (+1%)
Q2 2020 5.66B 5.55B -0.11B (-2%)
Q1 2020 7.60B 7.49B -0.11B (-1%)
Q4 2019 8.46B 8.18B -0.28B (-3%)
Q3 2019 9.07B 8.72B -0.35B (-4%)
Q2 2019 9.63B 9.05B -0.58B (-6%)
Q1 2019 9.35B 8.78B -0.57B (-6%)
Q3 2018 9.79B 10.15B +365.00M (+4%)
Q2 2018 9.37B 10.21B +836.00M (+9%)
Q1 2018 9.36B 9.77B +407.00M (+4%)
Q4 2017 8.76B 9.13B +375.00M (+4%)
Q3 2017 8.21B 8.52B +306.00M (+4%)
Q2 2017 8.53B 8.40B -0.13B (-2%)
Q1 2017 7.79B 8.43B +640.00M (+8%)
Q4 2016 7.31B 7.75B +437.00M (+6%)
Q3 2016 7.49B 7.37B -0.12B (-2%)
Q2 2016 7.64B 7.33B -0.31B (-4%)
Q1 2016 7.10B 6.74B -0.36B (-5%)
Q4 2015 7.64B 7.07B -0.57B (-7%)
Q3 2015 9.05B 8.33B -0.72B (-8%)
Q2 2015 8.92B 9.14B +225.00M (+2%)
Q1 2015 9.48B 8.19B -1.30B (-14%)
Q4 2014 10.86B 10.29B -0.57B (-5%)
Q3 2014 11.86B 12.07B +210.00M (+2%)
Q2 2014 11.45B 12.12B +670.00M (+6%)
Q1 2014 11.17B 11.14B -30.00M (-0%)
Q4 2013 10.76B 11.14B +378.00M (+4%)
Q3 2013 10.76B 11.15B +390.00M (+4%)
Q2 2013 11.30B 11.10B -0.20B (-2%)
Q1 2013 11.16B 10.67B -0.49B (-4%)
Quotes delayed 20 minutes

Email EnvelopeFree LYB Email Alerts:
Get Dividend Alerts
Get SEC Filing Alerts
10 Most Oversold S&P 500 Stocks
10 Most Overbought S&P 500 Stocks
10 ETFs With Stocks Insiders Are Buying
10 ETFs With Most Upside To Targets
The DividendRank Top 25
Warren Buffett Dividend Stocks
10 Cheap Dividend Stocks Under $10
10 Top DividendRank'ed Energy Stocks
The 10 Highest Yielding Preferred Stocks
The 15 Most Active S&P Call & Put Options

Next Earnings Date Calendar:

Penguin Solutions (PENG): 7/7/2026 After close
Kura Sushi USA (KRUS): 7/7/2026 After close
Enerpac Tool Group (EPAC): 7/7/2026 After close
Helen Of Troy (HELE): 7/8/2026 6:45 AM
Pure Cycle (PCYO): 7/8/2026 After close
Pricesmart (PSMT): 7/8/2026 After close
Levi Strauss (LEVI): 7/8/2026 After close
AZZ (AZZ): 7/8/2026 After close
PepsiCo (PEP): 7/9/2026 6:00 AM
Simply Good Foods (SMPL): 7/9/2026 7:00 AM

More from the Next Earnings Dates Calendar

Earnings History:

Immersion (IMMR): 7/6/2026 After close
All In FutureTech (AIFA): 7/6/2026 7:00 AM
Lindsay (LNN): 7/2/2026 6:45 AM
National Beverage (FIZZ): 7/1/2026 5:15 PM
Franklin Covey (FC): 7/1/2026 After close
Greenbrier Companies (GBX): 7/1/2026 After close
Culp (CULP): 7/1/2026 After close
Bassett Furniture Indus (BSET): 7/1/2026 After close
UniFirst (UNF): 7/1/2026 8:00 AM
FactSet Research Systems (FDS): 7/1/2026 7:00 AM

More from the Earnings History archive
LyondellBasell Industries (LYB) is categorized under the Materials sector; to help you further research past earnings across stocks, below are some other companies in the same sector:

MAGN Historical Earnings
MAS Historical Earnings
MATV Historical Earnings
MBII Historical Earnings
METC Historical Earnings
MHK Historical Earnings
MLM Historical Earnings
MOS Historical Earnings
MP Historical Earnings
MTRN Historical Earnings
On this page we presented the LYB earnings surprises information for LyondellBasell Industries, comparing the expected earnings versus the actual earnings quarter by quarter, with the resulting positive or negative percentage surprise. Any self directed investor doing their due diligence on LYB (or any other given stock) can benefit from researching all of the LyondellBasell Industries past earnings going backwards in time, including how often the company beat or missed the market's expectations. To help you with this LyondellBasell Industries earnings surprise research, on this page we presented each quarter's resulting numbers for easy comparison. Studying these numbers can help an investor by providing important context with which to think about LYB's next earnings report. In your continued research on LyondellBasell Industries we hope you will be sure to check out the further links included for revenue and earnings history as well as next earnings dates for LYB. Thanks for visiting, and the next time you need to research LYB earnings surprises or those of another stock, we hope you'll think of our site as your go-to earnings surprises research resource of choice.
 

LYB Earnings Surprises | www.NextEarningsDate.com | Copyright © 2020 - 2026, All Rights Reserved

Nothing in NextEarningsDate.com is intended to be investment advice, nor does it represent the opinion of, counsel from, or recommendations by BNK Invest Inc. or any of its affiliates, subsidiaries or partners. None of the information contained herein constitutes a recommendation that any particular security, portfolio, transaction, or investment strategy is suitable for any specific person. All viewers agree that under no circumstances will BNK Invest, Inc,. its subsidiaries, partners, officers, employees, affiliates, or agents be held liable for any loss or damage caused by your reliance on information obtained. By visiting, using or viewing this site, you agree to the following Full Disclaimer & Terms of Use and Privacy Policy. Video widget and market videos powered by Market News Video. Quote and option data delayed at least 15 minutes; stock quote data powered by Ticker Technologies, and Mergent.
X
Wait! Don't leave yet.
Want to receive our latest research absolutely free?


Click the button below for your complimentary copy of Your Early Retirement Portfolio: Dividends Up to 8.2%—Every Month—Forever.

You'll discover the details on 4 stocks and funds that pay you massive dividends as high as 8.2%.