LMNX Earnings Surprises image   This page last updated 8/25/2021
LMNX Earnings Surprises Chart
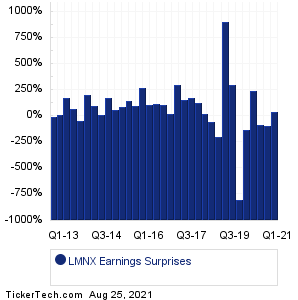
Data adjusted for LMNX split history

PeriodExpectedActualSurprise
Q1 2021 0.14 0.19 +0.05 (+36%)
Q4 2020 0.13 0.01 -0.12 (-92%)
Q3 2020 0.20 0.04 -0.16 (-80%)
Q2 2020 0.08 0.27 +0.19 (+238%)
Q1 2020 -0.03 0.01 +0.04 (-133%)
Q4 2019 -0.01 0.07 +0.08 (-800%)
Q3 2019 -0.03 -0.12 -0.09 (+300%)
Q2 2019 -0.01 -0.10 -0.09 (+900%)
Q1 2019 0.07 -0.07 -0.14 (-200%)
Q4 2018 0.09 0.04 -0.05 (-56%)
Q1 2018 0.20 0.25 +0.05 (+25%)
Q4 2017 0.09 0.20 +0.11 (+122%)
Q3 2017 0.09 0.25 +0.16 (+178%)
Q2 2017 0.10 0.26 +0.16 (+160%)
Q1 2017 0.07 0.28 +0.21 (+300%)
Q4 2016 0.09 0.11 +0.02 (+22%)
Q3 2016 0.10 0.21 +0.11 (+110%)
Q2 2016 0.15 0.33 +0.18 (+120%)
Q1 2016 0.14 0.29 +0.15 (+107%)
Q4 2015 0.15 0.56 +0.41 (+273%)
Q3 2015 0.11 0.22 +0.11 (+100%)
Q2 2015 0.11 0.27 +0.16 (+145%)
Q1 2015 0.12 0.23 +0.11 (+92%)
Q4 2014 0.12 0.19 +0.07 (+58%)
Q3 2014 0.10 0.27 +0.17 (+170%)
Q2 2014 0.10 0.11 +0.01 (+10%)
Q1 2014 0.12 0.24 +0.12 (+100%)
Q4 2013 0.07 0.21 +0.14 (+200%)
Q3 2013 0.11 0.06 -0.05 (-45%)
Q2 2013 0.10 0.17 +0.07 (+70%)
Q1 2013 0.07 0.19 +0.12 (+171%)
Q4 2012 0.09 0.10 +0.01 (+11%)
Q2 2012 0.08 0.07 -0.01 (-12%)
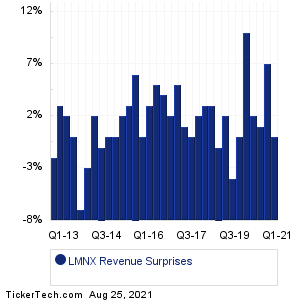
LMNX Revenue Surprises Chart
PeriodExpectedActualSurprise
Q1 2021 110.69M 110.69M -2000 (0%)
Q4 2020 104.57M 111.39M +6.82M (+7%)
Q3 2020 105.02M 106.06M +1.04M (+1%)
Q2 2020 107.33M 109.52M +2.19M (+2%)
Q1 2020 82.30M 90.42M +8.12M (+10%)
Q4 2019 90.60M 90.50M -99000 (-0%)
Q3 2019 81.76M 78.67M -3.09M (-4%)
Q2 2019 81.70M 83.06M +1.36M (+2%)
Q1 2019 83.11M 82.41M -0.70M (-1%)
Q4 2018 78.97M 81.13M +2.16M (+3%)
Q1 2018 80.47M 82.66M +2.19M (+3%)
Q4 2017 77.00M 78.20M +1.20M (+2%)
Q3 2017 74.37M 74.14M -0.23M (-0%)
Q2 2017 75.47M 76.46M +987000 (+1%)
Q1 2017 74.19M 77.78M +3.59M (+5%)
Q4 2016 70.92M 72.27M +1.35M (+2%)
Q3 2016 68.60M 71.22M +2.62M (+4%)
Q2 2016 61.20M 64.17M +2.97M (+5%)
Q1 2016 60.98M 62.98M +2.00M (+3%)
Q4 2015 60.21M 60.45M +239000 (0%)
Q3 2015 57.24M 60.60M +3.36M (+6%)
Q2 2015 57.01M 58.92M +1.91M (+3%)
Q1 2015 56.51M 57.74M +1.23M (+2%)
Q4 2014 58.31M 58.11M -0.20M (-0%)
Q3 2014 56.55M 56.70M +150000 (0%)
Q2 2014 55.91M 55.60M -0.31M (-1%)
Q1 2014 55.31M 56.60M +1.29M (+2%)
Q4 2013 56.63M 55.20M -1.43M (-3%)
Q3 2013 54.67M 50.80M -3.87M (-7%)
Q2 2013 54.16M 54.30M +140000 (0%)
Q1 2013 51.94M 53.20M +1.26M (+2%)
Q4 2012 54.04M 55.50M +1.46M (+3%)
Q2 2012 49.22M 48.30M -0.92M (-2%)
Quotes delayed 20 minutes
Get Free SEC filing alerts for LMNX:
LMNX SEC Filing Email Alerts ServiceExternal link
10 Most Oversold S&P 500 Stocks
10 Most Overbought S&P 500 Stocks
10 ETFs With Stocks Insiders Are Buying
10 ETFs With Most Upside To Targets
The DividendRank Top 25
Warren Buffett Dividend Stocks
10 Cheap Dividend Stocks Under $10
10 Top DividendRank'ed Energy Stocks
The 10 Highest Yielding Preferred Stocks
The 15 Most Active S&P Call & Put Options

Next Earnings Date Calendar:

CarLotz (LOTZ): 8/25/2021 3:39 AM
Ortho Clinical Diagnostic (OCDX): 8/25/2021 4:02 AM
Qualtrics International (XM): 8/25/2021 4:07 AM
Fisker (FSR): 8/25/2021 5:00 AM
SQZ Biotechnologies (SQZ): 8/25/2021 5:05 AM
Express (EXPR): 8/25/2021 6:45 AM
Dick's Sporting Goods (DKS): 8/25/2021 7:30 AM
Photronics (PLAB): 8/25/2021 8:00 AM
Shoe Carnival (SCVL): 8/25/2021 8:00 AM
Autodesk (ADSK): 8/25/2021 After close

More from the Next Earnings Dates Calendar

Earnings History:

Toll Brothers (TOL): 8/24/2021 After close
Electromed (ELMD): 8/24/2021 After close
Urban Outfitters (URBN): 8/24/2021 After close
Wheeler Real Estate IT (WHLR): 8/24/2021 After close
ScanSource (SCSC): 8/24/2021 After close
Heico (HEI): 8/24/2021 After close
Nordstrom (JWN): 8/24/2021 After close
Heico (HEI): 8/24/2021 After close
Intuit (INTU): 8/24/2021 After close
Patriot National Bancorp (PNBK): 8/24/2021 9:00 AM

More from the Earnings History archive
 

LMNX Earnings Surprises | www.NextEarningsDate.com | Copyright © 2020 - 2021, All Rights Reserved

Nothing in NextEarningsDate.com is intended to be investment advice, nor does it represent the opinion of, counsel from, or recommendations by BNK Invest Inc. or any of its affiliates, subsidiaries or partners. None of the information contained herein constitutes a recommendation that any particular security, portfolio, transaction, or investment strategy is suitable for any specific person. All viewers agree that under no circumstances will BNK Invest, Inc,. its subsidiaries, partners, officers, employees, affiliates, or agents be held liable for any loss or damage caused by your reliance on information obtained. By visiting, using or viewing this site, you agree to the following Full Disclaimer & Terms of Use and Privacy Policy. Video widget and market videos powered by Market News Video. Quote and option data delayed at least 15 minutes; stock quote data powered by Ticker Technologies, and Mergent.