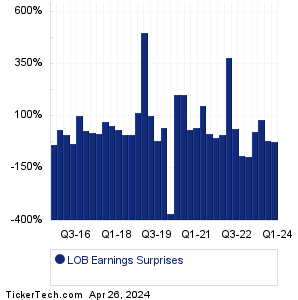
| Live Oak Bancshares Earnings Surprises | ||||||||||||||||||||||||||||||||||||||||||||||||||||||||||||||||||||||||||||||||||||||||||||||||||||||||||||||||||||||||||||||||||||||||||||
|
|
|
| Live Oak Bancshares Earnings Surprises | ||||||||||||||||||||||||||||||||||||||||||||||||||||||||||||||||||||||||||||||||||||||||||||||||||||||||||||||||||||||||||||||||||||||||||||
|
|
|
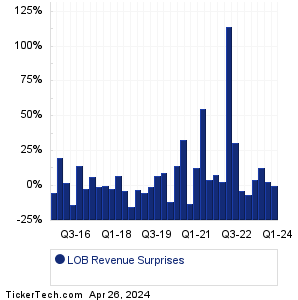
| LOB Revenue Surprises | ||||||||||||||||||||||||||||||||||||||||||||||||||||||||||||||||||||||||||||||||||||||||||||||||||||||||||||||||||||||||||||||||||||||||||||
|
| LOB Current Stock Quote |
Get Dividend Alerts Get SEC Filing Alerts |
| LOB Stock Price Chart |
| Next Earnings Dates |
Next Earnings Date Calendar:Fastenal (FAST): 4/11/2024 6:00 AMHooker Furnishings (HOFT): 4/11/2024 6:00 AM Conn's (CONN): 4/11/2024 6:00 AM HF Sinclair (DINO): 4/11/2024 6:30 AM CarMax (KMX): 4/11/2024 6:50 AM Lovesac (LOVE): 4/11/2024 7:00 AM Constellation Brands (STZ): 4/11/2024 7:30 AM Northern Technologies (NTIC): 4/11/2024 8:00 AM Kore Group Holdings (KORE): 4/11/2024 8:00 AM Applied Digital (APLD): 4/11/2024 After close More from the Next Earnings Dates Calendar Earnings History:Richardson Electronics (RELL): 4/10/2024 After closeLakeland Industries (LAKE): 4/10/2024 After close Rent the Runway (RENT): 4/10/2024 After close Pure Cycle (PCYO): 4/10/2024 After close Greenidge Generation Hldg (GREE): 4/10/2024 8:00 AM Nurix Therapeutics (NRIX): 4/10/2024 7:00 AM Delta Air Lines (DAL): 4/10/2024 6:30 AM Intensity Therapeutics (INTS): 4/9/2024 After close Aehr Test Systems (AEHR): 4/9/2024 After close SMART Glb Hldgs (SGH): 4/9/2024 After close More from the Earnings History archive |
| Earnings Peers |
| Live Oak Bancshares (LOB) is categorized under the Financials sector; to help you further research past earnings across stocks, below are some other companies in the same sector:
LPLA Historical Earnings LPRO Historical Earnings LSBK Historical Earnings LSI Historical Earnings LTC Historical Earnings LUXH Historical Earnings LXP Historical Earnings MAA Historical Earnings MAC Historical Earnings MAX Historical Earnings |
Recommended: Institutional Holders of ACES, WY Videos, AEHL market cap history.
Click the button below for your complimentary copy of Your Early Retirement Portfolio: Dividends Up to 8.7%—Every Month—Forever.
You'll discover the details on 4 stocks and funds that pay you massive dividends as high as 8.7%.