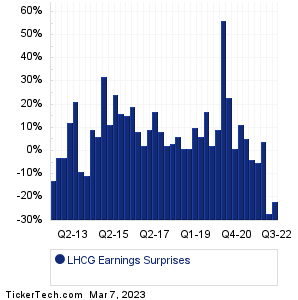
| LHCG Earnings Surprises | ||||||||||||||||||||||||||||||||||||||||||||||||||||||||||||||||||||||||||||||||||||||||||||||||||||||||||||||||||||||||||||||||||||||||||||||||||||||||||||||||||||
|
|
|
| LHCG Earnings Surprises | ||||||||||||||||||||||||||||||||||||||||||||||||||||||||||||||||||||||||||||||||||||||||||||||||||||||||||||||||||||||||||||||||||||||||||||||||||||||||||||||||||||
|
|
|
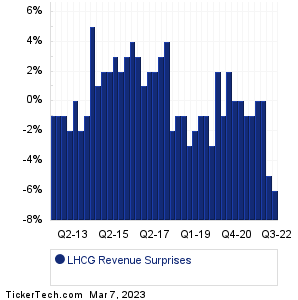
| LHCG Revenue Surprises | ||||||||||||||||||||||||||||||||||||||||||||||||||||||||||||||||||||||||||||||||||||||||||||||||||||||||||||||||||||||||||||||||||||||||||||||||||||||||||||||||||||
|
| LHCG Current Stock Quote |
Get Dividend Alerts Get SEC Filing Alerts |
| LHCG Stock Price Chart |
| Next Earnings Dates |
Next Earnings Date Calendar:Rumble (RUM): 3/7/2023 1:37 AMExcelerate Energy (EE): 3/7/2023 5:11 AM Squarespace (SQSP): 3/7/2023 6:00 AM First Watch Restaurant Gr (FWRG): 3/7/2023 6:00 AM Thor Industries (THO): 3/7/2023 6:30 AM ESAB (ESAB): 3/7/2023 6:30 AM Seres Therapeutics (MCRB): 3/7/2023 7:00 AM Voyager Therapeutics (VYGR): 3/7/2023 7:00 AM 908 Devices (MASS): 3/7/2023 7:00 AM BlackSky Technology (BKSY): 3/7/2023 7:00 AM More from the Next Earnings Dates Calendar Earnings History:Pactiv Evergreen (PTVE): 3/6/2023 9:00 PMvTv Therapeutics (VTVT): 3/6/2023 5:30 PM Intrusion (INTZ): 3/6/2023 After close Aris Water Solutions (ARIS): 3/6/2023 After close Markforged Holding Corporation Common Stock (MKFG): 3/6/2023 After close Tabula Rasa HealthCare (TRHC): 3/6/2023 After close Seacor Marine Hldgs (SMHI): 3/6/2023 After close Ellington Residential (EARN): 3/6/2023 After close NCS Multistage Holdings (NCSM): 3/6/2023 After close Intrepid Potash (IPI): 3/6/2023 After close More from the Earnings History archive |
| Earnings Peers |
| LHC Group (LHCG) is categorized under the Healthcare sector; to help you further research past earnings across stocks, below are some other companies in the same sector:
LHDX Historical Earnings LIFE Historical Earnings LIXT Historical Earnings LJPC Historical Earnings LLY Historical Earnings LMAT Historical Earnings LMNX Historical Earnings LNSR Historical Earnings LNTH Historical Earnings LOGC Historical Earnings |
Recommended: Top Ten Hedge Funds Holding JAGX, ETFs Holding PPC, BKE Insider Buying.