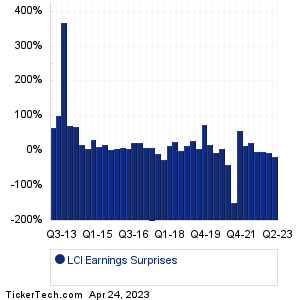
| Lannett Earnings Surprises | ||||||||||||||||||||||||||||||||||||||||||||||||||||||||||||||||||||||||||||||||||||||||||||||||||||||||||||||||||||||||||||||||||||||||||||||||||||||||||||||||
|
|
|
| Lannett Earnings Surprises | ||||||||||||||||||||||||||||||||||||||||||||||||||||||||||||||||||||||||||||||||||||||||||||||||||||||||||||||||||||||||||||||||||||||||||||||||||||||||||||||||
|
|
|
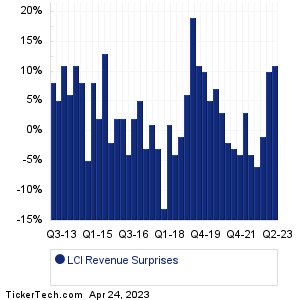
| LCI Revenue Surprises | ||||||||||||||||||||||||||||||||||||||||||||||||||||||||||||||||||||||||||||||||||||||||||||||||||||||||||||||||||||||||||||||||||||||||||||||||||||||||||||||||
|
| LCI Current Stock Quote |
Get Dividend Alerts Get SEC Filing Alerts |
| LCI Stock Price Chart |
| Next Earnings Dates |
Next Earnings Date Calendar:Bank of Hawaii (BOH): 4/24/2023 6:45 AMCoca-Cola (KO): 4/24/2023 6:55 AM Dynex Cap (DX): 4/24/2023 8:00 AM Washington Trust Bancorp (WASH): 4/24/2023 8:00 AM Bank of Marin (BMRC): 4/24/2023 8:00 AM AGNC Investment (AGNC): 4/24/2023 After close First Republic Bank (FRC): 4/24/2023 After close Trustco Bank (TRST): 4/24/2023 After close P3 Health Partners (PIII): 4/24/2023 After close Heartland Financial USA (HTLF): 4/24/2023 After close More from the Next Earnings Dates Calendar Earnings History:Norwood Financial (NWFL): 4/21/2023 After closeCryo-Cell International (CCEL): 4/21/2023 After close Park Ntl (PRK): 4/21/2023 After close PCB Bancorp (PCB): 4/21/2023 After close MetroCity Bankshares (MCBS): 4/21/2023 10:53 AM Acme United (ACU): 4/21/2023 9:00 AM Freeport-McMoRan (FCX): 4/21/2023 8:00 AM Fidelity D & D Bancorp (FDBC): 4/21/2023 7:00 AM HCA Healthcare (HCA): 4/21/2023 7:00 AM Procter & Gamble (PG): 4/21/2023 6:55 AM More from the Earnings History archive |
| Earnings Peers |
| Lannett (LCI) is categorized under the Healthcare sector; to help you further research past earnings across stocks, below are some other companies in the same sector:
LFMD Historical Earnings LFST Historical Earnings LGND Historical Earnings LGVN Historical Earnings LH Historical Earnings LHCG Historical Earnings LHDX Historical Earnings LIFE Historical Earnings LIXT Historical Earnings LJPC Historical Earnings |
Recommended: LIN Videos, Top Ten Hedge Funds Holding LINE, NSPR Historical Stock Prices.