KSU Earnings Surprises image   This KSU earnings surprises page last updated 10/21/2021
KSU Earnings Surprises Chart
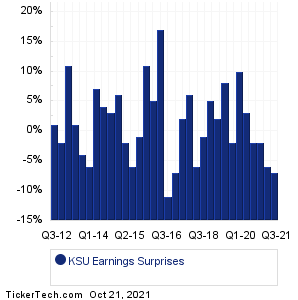
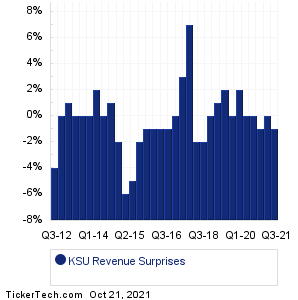
Data adjusted for KSU split history

PeriodExpectedActualSurprise
Q3 2021 2.17 2.02 -0.15 (-7%)
Q2 2021 2.19 2.06 -0.13 (-6%)
Q1 2021 1.94 1.91 -0.03 (-2%)
Q4 2020 1.92 1.89 -0.03 (-2%)
Q3 2020 1.90 1.96 +0.06 (+3%)
Q1 2020 1.78 1.96 +0.18 (+10%)
Q4 2019 1.85 1.82 -0.03 (-2%)
Q3 2019 1.79 1.94 +0.15 (+8%)
Q2 2019 1.61 1.64 +0.03 (+2%)
Q1 2019 1.46 1.54 +0.08 (+5%)
Q3 2018 1.59 1.57 -0.02 (-1%)
Q1 2018 1.38 1.30 -0.08 (-6%)
Q2 2017 1.25 1.33 +0.08 (+6%)
Q1 2017 1.15 1.17 +0.02 (+2%)
Q4 2016 1.20 1.12 -0.08 (-7%)
Q3 2016 1.26 1.12 -0.14 (-11%)
Q2 2016 1.04 1.22 +0.18 (+17%)
Q1 2016 0.98 1.03 +0.05 (+5%)
Q4 2015 1.11 1.23 +0.12 (+11%)
Q3 2015 1.22 1.21 -0.01 (-1%)
Q2 2015 1.10 1.03 -0.07 (-6%)
Q1 2015 1.11 1.09 -0.02 (-2%)
Q4 2014 1.20 1.27 +0.07 (+6%)
Q3 2014 1.25 1.29 +0.04 (+3%)
Q2 2014 1.16 1.21 +0.05 (+4%)
Q1 2014 0.98 1.05 +0.07 (+7%)
Q4 2013 1.10 1.03 -0.07 (-6%)
Q3 2013 1.11 1.07 -0.04 (-4%)
Q2 2013 0.95 0.96 +0.01 (+1%)
Q4 2012 0.83 0.92 +0.09 (+11%)
Q3 2012 0.84 0.82 -0.02 (-2%)
Q2 2012 0.84 0.85 +0.01 (+1%)
KSU Revenue Surprises Chart
PeriodExpectedActualSurprise
Q3 2021 750.66M 744.00M -6.66M (-1%)
Q2 2021 750.77M 749.50M -1.27M (-0%)
Q1 2021 710.89M 706.00M -4.89M (-1%)
Q4 2020 695.77M 693.40M -2.37M (-0%)
Q3 2020 662.69M 659.60M -3.09M (-0%)
Q1 2020 716.18M 731.70M +15.52M (+2%)
Q4 2019 730.94M 729.50M -1.44M (-0%)
Q3 2019 734.08M 747.70M +13.62M (+2%)
Q2 2019 706.23M 714.00M +7.77M (+1%)
Q1 2019 674.73M 674.80M +70000 (0%)
Q3 2018 715.10M 699.00M -16.10M (-2%)
Q1 2018 649.41M 638.60M -10.81M (-2%)
Q2 2017 614.77M 656.40M +41.63M (+7%)
Q1 2017 593.82M 609.50M +15.68M (+3%)
Q4 2016 597.21M 598.50M +1.29M (0%)
Q3 2016 608.98M 604.50M -4.48M (-1%)
Q2 2016 572.96M 568.50M -4.46M (-1%)
Q1 2016 567.30M 562.70M -4.60M (-1%)
Q4 2015 604.53M 598.00M -6.53M (-1%)
Q3 2015 644.13M 631.90M -12.23M (-2%)
Q2 2015 615.40M 585.80M -29.60M (-5%)
Q1 2015 640.23M 603.10M -37.13M (-6%)
Q4 2014 658.72M 642.50M -16.22M (-2%)
Q3 2014 671.16M 677.50M +6.34M (+1%)
Q2 2014 647.29M 649.70M +2.41M (0%)
Q1 2014 597.59M 607.40M +9.81M (+2%)
Q4 2013 617.76M 615.60M -2.16M (-0%)
Q3 2013 622.27M 621.60M -0.67M (-0%)
Q2 2013 576.70M 579.30M +2.60M (0%)
Q4 2012 564.40M 568.40M +4.00M (+1%)
Q3 2012 578.42M 577.40M -1.02M (-0%)
Q2 2012 569.93M 545.30M -24.63M (-4%)
Quotes delayed 20 minutes

Email EnvelopeFree KSU Email Alerts:
Get Dividend Alerts
Get SEC Filing Alerts
10 Most Oversold S&P 500 Stocks
10 Most Overbought S&P 500 Stocks
10 ETFs With Stocks Insiders Are Buying
10 ETFs With Most Upside To Targets
The DividendRank Top 25
Warren Buffett Dividend Stocks
10 Cheap Dividend Stocks Under $10
10 Top DividendRank'ed Energy Stocks
The 10 Highest Yielding Preferred Stocks
The 15 Most Active S&P Call & Put Options

Next Earnings Date Calendar:

Allegion (ALLE): 10/21/2021 5:30 AM
Danaher (DHR): 10/21/2021 6:00 AM
Dow (DOW): 10/21/2021 6:00 AM
Chart Industries (GTLS): 10/21/2021 6:00 AM
TRI Pointe Group (TPH): 10/21/2021 6:00 AM
Tractor Supply (TSCO): 10/21/2021 6:05 AM
Southwest Airlines (LUV): 10/21/2021 6:30 AM
Valero Energy (VLO): 10/21/2021 6:30 AM
KeyCorp (KEY): 10/21/2021 6:30 AM
Snap-on (SNA): 10/21/2021 6:30 AM

More from the Next Earnings Dates Calendar

Earnings History:

Great Southern Bancorp (GSBC): 10/20/2021 6:30 PM
NextPlay Technologies (NXTP): 10/20/2021 5:20 PM
Schmitt Industries (SMIT): 10/20/2021 5:00 PM
Heritage-Crystal Clean (HCCI): 10/20/2021 5:00 PM
Amerant Bancorp (AMTB): 10/20/2021 5:00 PM
Metropolitan Bank Holding (MCB): 10/20/2021 5:00 PM
CVB Financial (CVBF): 10/20/2021 5:00 PM
Kaiser Aluminum (KALU): 10/20/2021 After close
OneMain Holdings (OMF): 10/20/2021 After close
SLM (SLM): 10/20/2021 After close

More from the Earnings History archive
Kansas City Southern (KSU) is categorized under the Industrials sector; to help you further research past earnings across stocks, below are some other companies in the same sector:

KTCC Past Earnings
KTOS Past Earnings
LAWS Past Earnings
LDL Past Earnings
LDOS Past Earnings
LECO Past Earnings
LFUS Past Earnings
LHX Past Earnings
LII Past Earnings
LMB Past Earnings
On this page we presented the KSU earnings surprises information for Kansas City Southern, comparing the expected earnings versus the actual earnings quarter by quarter, with the resulting positive or negative percentage surprise. Any self directed investor doing their due diligence on KSU (or any other given stock) can benefit from researching all of the Kansas City Southern past earnings going backwards in time, including how often the company beat or missed the market's expectations. To help you with this Kansas City Southern earnings surprise research, on this page we presented each quarter's resulting numbers for easy comparison. Studying these numbers can help an investor by providing important context with which to think about KSU's next earnings report. In your continued research on Kansas City Southern we hope you will be sure to check out the further links included for revenue and earnings history as well as next earnings dates for KSU. Thanks for visiting, and the next time you need to research KSU earnings surprises or those of another stock, we hope you'll think of our site as your go-to earnings surprises research resource of choice.
 

KSU Earnings Surprises | www.NextEarningsDate.com | Copyright © 2020 - 2021, All Rights Reserved

Nothing in NextEarningsDate.com is intended to be investment advice, nor does it represent the opinion of, counsel from, or recommendations by BNK Invest Inc. or any of its affiliates, subsidiaries or partners. None of the information contained herein constitutes a recommendation that any particular security, portfolio, transaction, or investment strategy is suitable for any specific person. All viewers agree that under no circumstances will BNK Invest, Inc,. its subsidiaries, partners, officers, employees, affiliates, or agents be held liable for any loss or damage caused by your reliance on information obtained. By visiting, using or viewing this site, you agree to the following Full Disclaimer & Terms of Use and Privacy Policy. Video widget and market videos powered by Market News Video. Quote and option data delayed at least 15 minutes; stock quote data powered by Ticker Technologies, and Mergent.