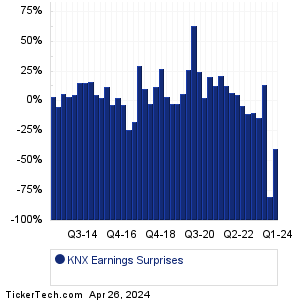
| KNX Earnings Surprises | ||||||||||||||||||||||||||||||||||||||||||||||||||||||||||||||||||||||||||||||||||||||||||||||||||||||||||||||||||||||||||||||||||||||||||||||||||||||||||||||||||||||||
|
|
|
| KNX Earnings Surprises | ||||||||||||||||||||||||||||||||||||||||||||||||||||||||||||||||||||||||||||||||||||||||||||||||||||||||||||||||||||||||||||||||||||||||||||||||||||||||||||||||||||||||
|
|
|
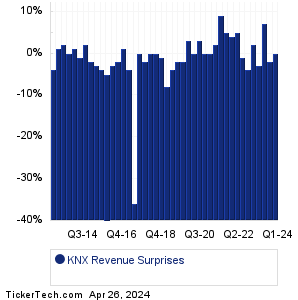
| KNX Revenue Surprises | ||||||||||||||||||||||||||||||||||||||||||||||||||||||||||||||||||||||||||||||||||||||||||||||||||||||||||||||||||||||||||||||||||||||||||||||||||||||||||||||||||||||||
|
| KNX Current Stock Quote |
Get Dividend Alerts Get SEC Filing Alerts |
| KNX Stock Price Chart |
| Next Earnings Dates |
Next Earnings Date Calendar:Acuity Brands (AYI): 4/3/2024 6:00 AMResources Connection (RGP): 4/3/2024 After close Sportsman's Warehouse (SPWH): 4/3/2024 After close Simulations Plus (SLP): 4/3/2024 After close Levi Strauss (LEVI): 4/3/2024 After close BM Technologies (BMTX): 4/3/2024 After close RPM International (RPM): 4/4/2024 6:45 AM Lindsay (LNN): 4/4/2024 6:45 AM Simply Good Foods (SMPL): 4/4/2024 7:00 AM AngioDynamics (ANGO): 4/4/2024 7:00 AM More from the Next Earnings Dates Calendar Earnings History:Fluent (FLNT): 4/2/2024 After closeDave & Buster's Enter (PLAY): 4/2/2024 After close Cal-Maine Foods (CALM): 4/2/2024 After close Houston American Energy (HUSA): 4/2/2024 1:42 PM ClearOne (CLRO): 4/2/2024 9:10 AM Vaccinex (VCNX): 4/2/2024 8:30 AM Paychex (PAYX): 4/2/2024 8:30 AM Digital Ally (DGLY): 4/2/2024 8:00 AM AIM ImmunoTech (AIM): 4/2/2024 7:30 AM Ocugen (OCGN): 4/2/2024 7:00 AM More from the Earnings History archive |
| Earnings Peers |
| Knight-Swift (KNX) is categorized under the Industrials sector; to help you further research past earnings across stocks, below are some other companies in the same sector:
KSU Historical Earnings KTCC Historical Earnings KTOS Historical Earnings LASE Historical Earnings LAWS Historical Earnings LDL Historical Earnings LDOS Historical Earnings LECO Historical Earnings LFUS Historical Earnings LHX Historical Earnings |
Click the button below for your complimentary copy of Your Early Retirement Portfolio: Dividends Up to 9.5%—Every Month—Forever.
You'll discover the details on 4 stocks and funds that pay you massive dividends as high as 9.5%.