KLIC Earnings Surprises image   This KLIC earnings surprises page last updated 1/19/2022
KLIC Earnings Surprises Chart
Data adjusted for KLIC split history

PeriodExpectedActualSurprise
Q4 2021 2.13 2.17 +0.04 (+2%)
Q3 2021 1.36 1.87 +0.51 (+38%)
Q2 2021 1.14 1.26 +0.12 (+11%)
Q1 2021 0.75 0.86 +0.11 (+15%)
Q4 2020 0.31 0.29 -0.02 (-6%)
Q3 2020 0.14 0.21 +0.07 (+50%)
Q2 2020 0.18 0.22 +0.04 (+22%)
Q1 2020 0.14 0.24 +0.10 (+71%)
Q4 2019 0.12 0.14 +0.02 (+17%)
Q3 2019 0.07 0.06 -0.01 (-14%)
Q1 2019 0.19 0.25 +0.06 (+32%)
Q3 2018 0.61 0.89 +0.28 (+46%)
Q2 2018 0.43 0.54 +0.11 (+26%)
Q1 2018 0.26 0.54 +0.28 (+108%)
Q4 2017 0.36 0.51 +0.15 (+42%)
Q3 2017 0.47 0.62 +0.15 (+32%)
Q2 2017 0.32 0.40 +0.08 (+25%)
Q1 2017 0.10 0.22 +0.12 (+120%)
Q4 2016 0.11 0.15 +0.04 (+36%)
Q3 2016 0.37 0.45 +0.08 (+22%)
Q2 2016 0.04 0.07 +0.03 (+75%)
Q4 2015 0.17 0.13 -0.04 (-24%)
Q3 2015 0.17 0.15 -0.02 (-12%)
Q2 2015 0.12 0.10 -0.02 (-17%)
Q4 2014 0.42 0.38 -0.04 (-10%)
Q3 2014 0.35 0.34 -0.01 (-3%)
Q2 2014 0.11 0.12 +0.01 (+9%)
Q1 2014 -0.09 -0.03 +0.06 (-67%)
Q4 2013 0.41 0.39 -0.02 (-5%)
Q3 2013 0.14 0.25 +0.11 (+79%)
Q2 2013 0.02 0.10 +0.08 (+400%)
Q1 2013 0.06 0.05 -0.01 (-17%)
Q4 2012 0.83 0.89 +0.06 (+7%)
Q3 2012 0.67 0.90 +0.23 (+34%)
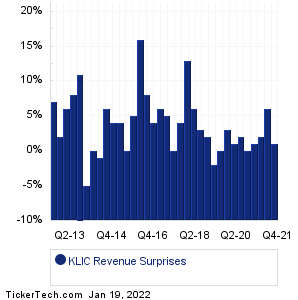
KLIC Revenue Surprises Chart
PeriodExpectedActualSurprise
Q4 2021 480.98M 485.33M +4.35M (+1%)
Q3 2021 399.94M 424.32M +24.38M (+6%)
Q2 2021 332.04M 340.16M +8.12M (+2%)
Q1 2021 264.94M 267.86M +2.92M (+1%)
Q4 2020 177.02M 177.69M +668000 (0%)
Q3 2020 147.92M 150.45M +2.53M (+2%)
Q2 2020 149.85M 150.74M +891000 (+1%)
Q1 2020 139.96M 144.30M +4.34M (+3%)
Q4 2019 140.11M 139.83M -0.28M (-0%)
Q3 2019 129.95M 127.11M -2.84M (-2%)
Q1 2019 154.83M 157.21M +2.38M (+2%)
Q3 2018 261.67M 268.83M +7.16M (+3%)
Q2 2018 210.01M 221.77M +11.76M (+6%)
Q1 2018 189.48M 213.69M +24.21M (+13%)
Q4 2017 208.37M 215.89M +7.52M (+4%)
Q3 2017 245.02M 243.90M -1.12M (-0%)
Q2 2017 190.89M 199.61M +8.72M (+5%)
Q1 2017 140.62M 149.64M +9.02M (+6%)
Q4 2016 140.09M 145.84M +5.75M (+4%)
Q3 2016 200.76M 216.41M +15.65M (+8%)
Q2 2016 135.00M 156.40M +21.40M (+16%)
Q4 2015 113.75M 119.17M +5.42M (+5%)
Q3 2015 165.00M 164.63M -0.37M (-0%)
Q2 2015 140.00M 145.23M +5.23M (+4%)
Q4 2014 186.67M 194.70M +8.03M (+4%)
Q3 2014 170.00M 180.50M +10.50M (+6%)
Q2 2014 115.00M 114.20M -0.80M (-1%)
Q1 2014 79.45M 79.10M -0.35M (-0%)
Q4 2013 183.33M 173.60M -9.73M (-5%)
Q3 2013 127.50M 141.20M +13.70M (+11%)
Q2 2013 97.94M 106.10M +8.16M (+8%)
Q1 2013 107.24M 114.00M +6.76M (+6%)
Q4 2012 262.77M 269.20M +6.43M (+2%)
Q3 2012 239.55M 255.50M +15.95M (+7%)
Quotes delayed 20 minutes

Email EnvelopeFree KLIC Email Alerts:
Get Dividend Alerts
Get SEC Filing Alerts
10 Most Oversold S&P 500 Stocks
10 Most Overbought S&P 500 Stocks
10 ETFs With Stocks Insiders Are Buying
10 ETFs With Most Upside To Targets
The DividendRank Top 25
Warren Buffett Dividend Stocks
10 Cheap Dividend Stocks Under $10
10 Top DividendRank'ed Energy Stocks
The 10 Highest Yielding Preferred Stocks
The 15 Most Active S&P Call & Put Options

Next Earnings Date Calendar:

UnitedHealth Group (UNH): 1/19/2022 5:55 AM
Commerce Bancshares (CBSH): 1/19/2022 6:00 AM
US Bancorp (USB): 1/19/2022 6:30 AM
Comerica (CMA): 1/19/2022 6:40 AM
Bank of America (BAC): 1/19/2022 6:45 AM
Fastenal (FAST): 1/19/2022 6:50 AM
Procter & Gamble (PG): 1/19/2022 7:00 AM
Citizens Financial Group (CFG): 1/19/2022 7:00 AM
Morgan Stanley (MS): 1/19/2022 7:30 AM
State Street (STT): 1/19/2022 7:30 AM

More from the Next Earnings Dates Calendar

Earnings History:

Pinnacle Financial (PNFP): 1/18/2022 5:15 PM
Novo Integrated Sciences (NVOS): 1/18/2022 After close
Fulton Financial (FULT): 1/18/2022 After close
United Community Banks (UCBI): 1/18/2022 After close
FB Financial (FBK): 1/18/2022 After close
Progress Software (PRGS): 1/18/2022 After close
Concentrix (CNXC): 1/18/2022 After close
JB Hunt Transport Servs (JBHT): 1/18/2022 After close
Amcon Distributing (DIT): 1/18/2022 After close
Bank First (BFC): 1/18/2022 After close

More from the Earnings History archive
Kulicke & Soffa Indus (KLIC) is categorized under the Technology sector; to help you further research past earnings across stocks, below are some other companies in the same sector:

KLTR Past Earnings
KN Past Earnings
KNBE Past Earnings
KOPN Past Earnings
KTB Past Earnings
KVHI Past Earnings
LASR Past Earnings
LAW Past Earnings
LEAF Past Earnings
LEGH Past Earnings
On this page we presented the KLIC earnings surprises information for Kulicke & Soffa Indus, comparing the expected earnings versus the actual earnings quarter by quarter, with the resulting positive or negative percentage surprise. Any self directed investor doing their due diligence on KLIC (or any other given stock) can benefit from researching all of the Kulicke & Soffa Indus past earnings going backwards in time, including how often the company beat or missed the market's expectations. To help you with this Kulicke & Soffa Indus earnings surprise research, on this page we presented each quarter's resulting numbers for easy comparison. Studying these numbers can help an investor by providing important context with which to think about KLIC's next earnings report. In your continued research on Kulicke & Soffa Indus we hope you will be sure to check out the further links included for revenue and earnings history as well as next earnings dates for KLIC. Thanks for visiting, and the next time you need to research KLIC earnings surprises or those of another stock, we hope you'll think of our site as your go-to earnings surprises research resource of choice.

Recommended: HSDT Insider Buying, Funds Holding OPHT, ETFs Holding SCVL.


KLIC Earnings Surprises | www.NextEarningsDate.com | Copyright © 2020 - 2022, All Rights Reserved

Nothing in NextEarningsDate.com is intended to be investment advice, nor does it represent the opinion of, counsel from, or recommendations by BNK Invest Inc. or any of its affiliates, subsidiaries or partners. None of the information contained herein constitutes a recommendation that any particular security, portfolio, transaction, or investment strategy is suitable for any specific person. All viewers agree that under no circumstances will BNK Invest, Inc,. its subsidiaries, partners, officers, employees, affiliates, or agents be held liable for any loss or damage caused by your reliance on information obtained. By visiting, using or viewing this site, you agree to the following Full Disclaimer & Terms of Use and Privacy Policy. Video widget and market videos powered by Market News Video. Quote and option data delayed at least 15 minutes; stock quote data powered by Ticker Technologies, and Mergent.