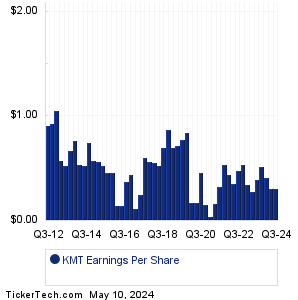
| Kennametal Earnings History | ||||||||||||||||||||||||||||||||||||||||||||||||||||||||||||||||||||||||||||||||||||||||||||||||||||||||||||||||||||||||||||||||||||||||||||||||||||||
|
|
|
| Kennametal Earnings History | ||||||||||||||||||||||||||||||||||||||||||||||||||||||||||||||||||||||||||||||||||||||||||||||||||||||||||||||||||||||||||||||||||||||||||||||||||||||
|
|
|
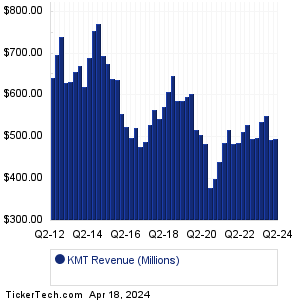
| KMT Revenue History | ||||||||||||||||||||||||||||||||||||||||||||||||||||||||||||||||||||||||||||||||||||||||||||||||||||||||||||||||||||||||||||||||||||||||||||||||||||||
|
| KMT Current Stock Quote |
Get Dividend Alerts Get SEC Filing Alerts |
| KMT Stock Price Chart |
| Next Earnings Dates |
Next Earnings Date Calendar:Fortrea Holdings (FTRE): 3/11/2024 7:00 AMOverseas Shipholding Gr (OSG): 3/11/2024 7:30 AM Genie Energy (GNE): 3/11/2024 7:30 AM Curis (CRIS): 3/11/2024 8:00 AM Ocular Therapeutix (OCUL): 3/11/2024 After close Ranpak Hldgs (PACK): 3/11/2024 After close NET Power (NPWR): 3/11/2024 After close Heritage Insurance Hldgs (HRTG): 3/11/2024 After close Assertio Holdings (ASRT): 3/11/2024 After close Amylyx Pharma (AMLX): 3/11/2024 After close More from the Next Earnings Dates Calendar Earnings History:Cue Biopharma (CUE): 3/9/2024 After closeOvid Therapeutics (OVID): 3/8/2024 8:00 AM America's Car-Mart (CRMT): 3/8/2024 8:00 AM Sigmatron International (SGMA): 3/8/2024 8:00 AM XOMA (XOMA): 3/8/2024 7:30 AM Dixie Gr (DXYN): 3/8/2024 7:00 AM Genesco (GCO): 3/8/2024 6:50 AM Nine Energy Service (NINE): 3/7/2024 5:00 PM Ring Energy (REI): 3/7/2024 After close Team (TISI): 3/7/2024 After close More from the Earnings History archive |
| Featured Articles |
| Earnings Peers |
| Kennametal (KMT) is categorized under the Industrials sector; to help you further research past earnings across stocks, below are some other companies in the same sector:
KNL Past Earnings KNX Past Earnings KSU Past Earnings KTCC Past Earnings KTOS Past Earnings LASE Past Earnings LAWS Past Earnings LDL Past Earnings LDOS Past Earnings LECO Past Earnings |
Recommended: LC shares outstanding history, Funds Holding AMU, MCLD YTD Return.
Click the button below for your complimentary copy of Your Early Retirement Portfolio: Dividends Up to 9.5%—Every Month—Forever.
You'll discover the details on 4 stocks and funds that pay you massive dividends as high as 9.5%.