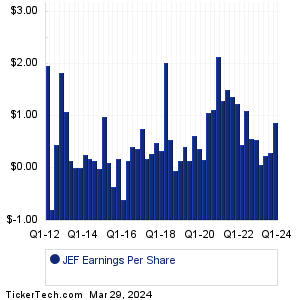
| Jefferies Financial Gr Earnings History | |||||||||||||||||||||||||||||||||||||||||||||||||||||||||||||||||||||||||||||||||||||||||||||||||||||||||||||||||||||||||||||||||||||||||||||
|
|
|
| Jefferies Financial Gr Earnings History | |||||||||||||||||||||||||||||||||||||||||||||||||||||||||||||||||||||||||||||||||||||||||||||||||||||||||||||||||||||||||||||||||||||||||||||
|
|
|
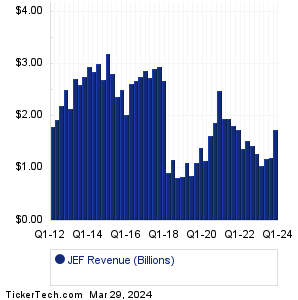
| JEF Revenue History | |||||||||||||||||||||||||||||||||||||||||||||||||||||||||||||||||||||||||||||||||||||||||||||||||||||||||||||||||||||||||||||||||||||||||||||
|
| JEF Current Stock Quote |
Get Dividend Alerts Get SEC Filing Alerts |
| JEF Stock Price Chart |
| Next Earnings Dates |
Next Earnings Date Calendar:Acuity Brands (AYI): 6/29/2023 6:00 AMGreenbrier Companies (GBX): 6/29/2023 6:00 AM McCormick & Co (MKC): 6/29/2023 6:30 AM MSC Industrial Direct Co (MSM): 6/29/2023 6:30 AM Lindsay (LNN): 6/29/2023 6:45 AM Simply Good Foods (SMPL): 6/29/2023 7:00 AM Rite Aid (RAD): 6/29/2023 7:00 AM Paychex (PAYX): 6/29/2023 8:30 AM PetVivo Hldgs (PETV): 6/29/2023 After close SMART Glb Hldgs (SGH): 6/29/2023 After close More from the Next Earnings Dates Calendar Earnings History:Kewaunee Scientific (KEQU): 6/28/2023 After closeVistaGen Therapeutics (VTGN): 6/28/2023 After close Culp (CULP): 6/28/2023 After close National Beverage (FIZZ): 6/28/2023 After close Worthington Industries (WOR): 6/28/2023 After close Concentrix (CNXC): 6/28/2023 After close American Outdoor Brands (AOUT): 6/28/2023 After close Franklin Covey (FC): 6/28/2023 After close H.B. Fuller (FUL): 6/28/2023 After close Micron Technology (MU): 6/28/2023 After close More from the Earnings History archive |
| Featured Articles |
| Earnings Peers |
| Jefferies Financial Gr (JEF) is categorized under the Financials sector; to help you further research past earnings across stocks, below are some other companies in the same sector:
JLL Past Earnings JMSB Past Earnings JOE Past Earnings JPM Past Earnings JXN Past Earnings JYNT Past Earnings KEY Past Earnings KFFB Past Earnings KFS Past Earnings KIM Past Earnings |
Recommended: Top Ten Hedge Funds Holding XSW, Funds Holding ANY, Funds Holding DY.
Click the button below for your complimentary copy of Your Early Retirement Portfolio: Dividends Up to 7.8%—Every Month—Forever.
You'll discover the details on 4 stocks and funds that pay you massive dividends as high as 7.8%.