j2 Global Earnings History image   This JCOM earnings history page last updated 9/20/2021
j2 Global Earnings History Chart
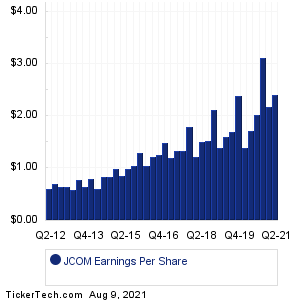
Data adjusted for JCOM split history
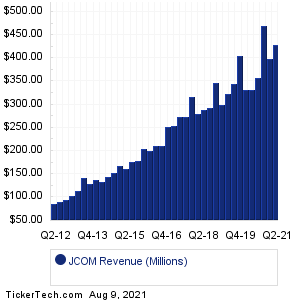
PeriodEarnings DateAdj. EPS
Q2 20218/5/20212.410
Q1 20215/10/20212.180
Q4 20202/11/20213.110
Q3 202011/2/20202.020
Q2 20208/10/20201.710
Q1 20205/11/20201.400
Q4 20192/10/20202.380
Q3 201910/31/20191.700
Q2 20198/6/20191.600
Q1 20195/7/20191.400
Q4 20182/12/20192.11
Q3 201811/5/20181.53
Q2 20188/9/20181.5
Q1 20185/7/20181.22
Q4 20172/6/20181.79
Q3 201711/2/20171.34
Q2 20178/3/20171.33
Q1 20175/8/20171.19
Q4 20162/9/20171.49
Q3 201611/1/20161.25
Q2 20168/3/20161.21
Q1 20165/5/20161.05
Q4 20152/10/20161.29
Q3 201511/3/20151.04
Q2 20158/4/20150.99
Q1 20155/7/20150.85
Q4 20142/12/20150.98
Q3 201411/5/20140.83
Q2 20148/5/20140.84
Q1 20145/8/20140.6
Q4 20132/13/20140.8
Q3 201311/5/20130.64
Q2 20138/7/20130.77
Q1 20135/8/20130.58
Q4 20122/13/20130.65
Q3 201211/1/20120.65
Q2 20128/1/20120.7
Q1 20125/3/20120.6
j2 Global Revenue History Chart
PeriodEarnings DateGAAP
Q2 20218/5/20210.43B
Q1 20215/10/20210.40B
Q4 20202/11/20210.47B
Q3 202011/2/20200.36B
Q2 20208/10/20200.33B
Q1 20205/11/20200.33B
Q4 20192/10/20200.41B
Q3 201910/31/20190.34B
Q2 20198/6/20190.32B
Q1 20195/7/20190.30B
Q4 20182/12/2019346.06M
Q3 201811/5/2018292.72M
Q2 20188/9/2018287.89M
Q1 20185/7/2018280.62M
Q4 20172/6/2018316.38M
Q3 201711/2/2017273.62M
Q2 20178/3/2017273.17M
Q1 20175/8/2017254.67M
Q4 20162/9/2017251.84M
Q3 201611/1/2016210.12M
Q2 20168/3/2016211.80M
Q1 20165/5/2016200.50M
Q4 20152/10/2016204.82M
Q3 201511/3/2015178.70M
Q2 20158/4/2015176.04M
Q1 20155/7/2015161.25M
Q4 20142/12/2015167.15M
Q3 201411/5/2014153.00M
Q2 20148/5/2014144.70M
Q1 20145/8/2014134.10M
Q4 20132/13/2014138.00M
Q3 201311/5/2013127.80M
Q2 20138/7/2013141.36M
Q1 20135/8/2013113.60M
Q4 20122/13/2013102.00M
Q3 201211/1/201293.20M
Q2 20128/1/201289.50M
Q1 20125/3/201286.65M
Quotes delayed 20 minutes
Get Free SEC filing alerts for JCOM:
JCOM SEC Filing Email Alerts ServiceExternal link
10 Most Oversold S&P 500 Stocks
10 Most Overbought S&P 500 Stocks
10 ETFs With Stocks Insiders Are Buying
10 ETFs With Most Upside To Targets
The DividendRank Top 25
Warren Buffett Dividend Stocks
10 Cheap Dividend Stocks Under $10
10 Top DividendRank'ed Energy Stocks
The 10 Highest Yielding Preferred Stocks
The 15 Most Active S&P Call & Put Options

Next Earnings Date Calendar:

Asana (ASAN): 9/20/2021 8:00 AM
Great Elm Group (GEG): 9/20/2021 After close
Kentucky First Federal (KFFB): 9/20/2021 After close
Lennar (LEN): 9/20/2021 After close
The L S Starrett (SCX): 9/21/2021 4:00 AM
Oscar Health (OSCR): 9/21/2021 4:07 AM
Apogee Enterprises (APOG): 9/21/2021 6:30 AM
AutoZone (AZO): 9/21/2021 8:00 AM
Cracker Barrel Old (CBRL): 9/21/2021 8:00 AM
Neogen (NEOG): 9/21/2021 8:45 AM

More from the Next Earnings Dates Calendar

Earnings History:

Butterfly Network (BFLY): 9/18/2021 5:14 AM
Auddia (AUUD): 9/18/2021 5:13 AM
Greenwich LifeSciences (GLSI): 9/17/2021 8:00 AM
FTS International (FTSI): 9/17/2021 6:35 AM
Kubient (KBNT): 9/16/2021 After close
Acutus Medical (AFIB): 9/16/2021 After close
Decibel Therapeutics (DBTX): 9/16/2021 5:15 AM
Rezolute (RZLT): 9/15/2021 After close
Reliance Global Group (RELI): 9/15/2021 6:58 AM
Gemini Therapeutics (GMTX): 9/15/2021 6:53 AM

More from the Earnings History archive
j2 Global (JCOM) is categorized under the Technology sector; to help you further research past earnings across stocks, below are some other companies in the same sector:

JCS Historical Earnings
JELD Historical Earnings
JKHY Historical Earnings
JNPR Historical Earnings
KLAC Historical Earnings
KN Historical Earnings
KOPN Historical Earnings
KTCC Historical Earnings
KVHI Historical Earnings
LDOS Historical Earnings
On this page we presented the JCOM earnings and revenue history archive for j2 Global, comparing the historical top line revenue performance quarter by quarter, as well as the JCOM earnings per share history. Any self directed investor doing their due diligence on JCOM (or any other given stock) can benefit from researching all of the j2 Global past earnings and revenue results going backwards in time, and to help you with this j2 Global earnings history research, on this page we presented each quarter's resulting numbers in both table and graphical form for easy comparison. Studying these numbers can help an investor by providing important context with which to think about JCOM's next earnings report. In your continued research on j2 Global we hope you will be sure to check out the further links included for earnings surprises as well as next earnings dates for JCOM. Thanks for visiting, and the next time you need to research JCOM earnings history (or the earnings history of another stock), we hope you'll think of our site as your go-to earnings history research resource of choice.
 

j2 Global Earnings History | www.NextEarningsDate.com | Copyright © 2020 - 2021, All Rights Reserved

Nothing in NextEarningsDate.com is intended to be investment advice, nor does it represent the opinion of, counsel from, or recommendations by BNK Invest Inc. or any of its affiliates, subsidiaries or partners. None of the information contained herein constitutes a recommendation that any particular security, portfolio, transaction, or investment strategy is suitable for any specific person. All viewers agree that under no circumstances will BNK Invest, Inc,. its subsidiaries, partners, officers, employees, affiliates, or agents be held liable for any loss or damage caused by your reliance on information obtained. By visiting, using or viewing this site, you agree to the following Full Disclaimer & Terms of Use and Privacy Policy. Video widget and market videos powered by Market News Video. Quote and option data delayed at least 15 minutes; stock quote data powered by Ticker Technologies, and Mergent.