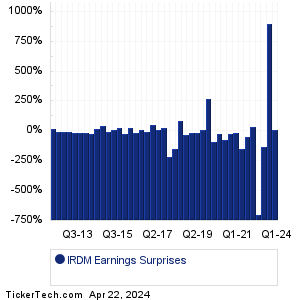
| Iridium Comms Earnings Surprises | ||||||||||||||||||||||||||||||||||||||||||||||||||||||||||||||||||||||||||||||||||||||||||||||||||||||||||||||||||||||||||||||||||||||||||||||||||||||||||||
|
|
|
| Iridium Comms Earnings Surprises | ||||||||||||||||||||||||||||||||||||||||||||||||||||||||||||||||||||||||||||||||||||||||||||||||||||||||||||||||||||||||||||||||||||||||||||||||||||||||||||
|
|
|
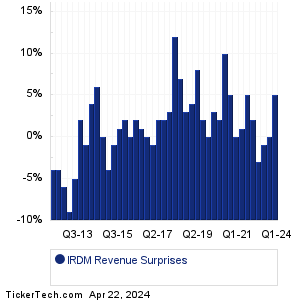
| IRDM Revenue Surprises | ||||||||||||||||||||||||||||||||||||||||||||||||||||||||||||||||||||||||||||||||||||||||||||||||||||||||||||||||||||||||||||||||||||||||||||||||||||||||||||
|
| IRDM Current Stock Quote |
Get Dividend Alerts Get SEC Filing Alerts |
| IRDM Stock Price Chart |
| Next Earnings Dates |
Next Earnings Date Calendar:KBR (KBR): 7/27/2023 5:53 AMLinde (LIN): 7/27/2023 6:00 AM Honeywell Intl (HON): 7/27/2023 6:00 AM Xcel Energy (XEL): 7/27/2023 6:00 AM West Pharmaceutical Servs (WST): 7/27/2023 6:00 AM Willis Towers Watson (WTW): 7/27/2023 6:00 AM LKQ (LKQ): 7/27/2023 6:00 AM FirstCash Hldgs (FCFS): 7/27/2023 6:00 AM Tri Pointe Homes (TPH): 7/27/2023 6:00 AM Integra Lifesciences (IART): 7/27/2023 6:00 AM More from the Next Earnings Dates Calendar Earnings History:Helix Energy Solns Gr (HLX): 7/26/2023 6:15 PMVeris Residential (VRE): 7/26/2023 6:04 PM Horizon Bancorp (HBNC): 7/26/2023 5:30 PM VSE (VSEC): 7/26/2023 5:30 PM Sun Communities (SUI): 7/26/2023 5:29 PM Bankwell Finl Gr (BWFG): 7/26/2023 5:15 PM Core Laboratories (CLB): 7/26/2023 5:15 PM Oceaneering International (OII): 7/26/2023 5:01 PM NewMarket (NEU): 7/26/2023 5:01 PM Teradyne (TER): 7/26/2023 5:01 PM More from the Earnings History archive |
| Earnings Peers |
| Iridium Comms (IRDM) is categorized under the Technology sector; to help you further research past earnings across stocks, below are some other companies in the same sector:
IRM Historical Earnings ISNS Historical Earnings ISSC Historical Earnings ITI Historical Earnings ITRI Historical Earnings JAMF Historical Earnings JCOM Historical Earnings JCS Historical Earnings JKHY Historical Earnings JNPR Historical Earnings |
Recommended: EPRT market cap history, PBHC Insider Buying, NVT Insider Buying.
Click the button below for your complimentary copy of Your Early Retirement Portfolio: Dividends Up to 7.8%—Every Month—Forever.
You'll discover the details on 4 stocks and funds that pay you massive dividends as high as 7.8%.