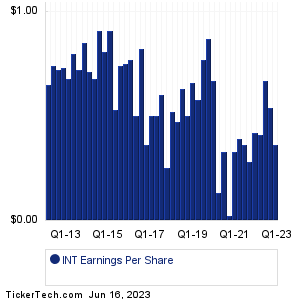
| INT Earnings History | ||||||||||||||||||||||||||||||||||||||||||||||||||||||||||||||||||||||||||||||||||||||||||||||||||||||||||||||||||||||||||||||||||||||||||
|
|
|
| INT Earnings History | ||||||||||||||||||||||||||||||||||||||||||||||||||||||||||||||||||||||||||||||||||||||||||||||||||||||||||||||||||||||||||||||||||||||||||
|
|
|
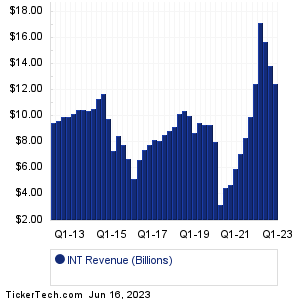
| INT Revenue History | ||||||||||||||||||||||||||||||||||||||||||||||||||||||||||||||||||||||||||||||||||||||||||||||||||||||||||||||||||||||||||||||||||||||||||
|
| INT Current Stock Quote |
Get Dividend Alerts Get SEC Filing Alerts |
| INT Stock Price Chart |
| Next Earnings Dates |
Next Earnings Date Calendar:Bank of New York Mellon (BK): 6/18/2023 6:30 AMReservoir Media (RSVR): 6/20/2023 7:00 AM Sumo Logic (SUMO): 6/20/2023 After close FedEx (FDX): 6/20/2023 After close La-Z-Boy (LZB): 6/20/2023 After close Patterson Cos (PDCO): 6/21/2023 7:00 AM Winnebago Industries (WGO): 6/21/2023 7:00 AM Avid Bioservices (CDMO): 6/21/2023 After close Steelcase (SCS): 6/21/2023 After close KB Home (KBH): 6/21/2023 After close More from the Next Earnings Dates Calendar Earnings History:Adobe (ADBE): 6/15/2023 After closeProFrac Holding (ACDC): 6/15/2023 After close John Wiley & Sons (WLY): 6/15/2023 8:30 AM Kroger (KR): 6/15/2023 8:00 AM Jabil (JBL): 6/15/2023 7:45 AM M-Tron Industries (MPTI): 6/15/2023 6:16 AM Enzo Biochem (ENZ): 6/14/2023 7:21 PM Anixa Biosciences (ANIX): 6/14/2023 5:09 PM Lennar (LEN): 6/14/2023 After close RF Industries (RFIL): 6/14/2023 After close More from the Earnings History archive |
| Featured Articles |
| Earnings Peers |
| World Fuel Servs (INT) is categorized under the Energy sector; to help you further research past earnings across stocks, below are some other companies in the same sector:
IO Past Earnings KLXE Past Earnings KMI Past Earnings KNTK Past Earnings KOS Past Earnings LBRT Past Earnings LPI Past Earnings MGY Past Earnings MIND Past Earnings MNRL Past Earnings |
Click the button below for your complimentary copy of Your Early Retirement Portfolio: Dividends Up to 7.8%—Every Month—Forever.
You'll discover the details on 4 stocks and funds that pay you massive dividends as high as 7.8%.