Imax Earnings Surprises image   This IMAX earnings surprises page last updated 11/19/2021
Imax Earnings Surprises Chart
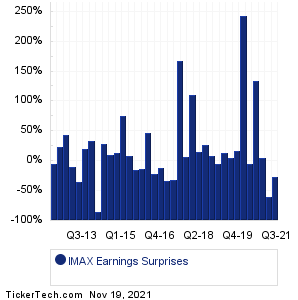
Data adjusted for IMAX split history
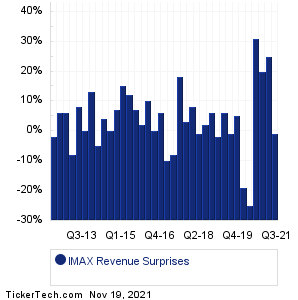
PeriodExpectedActualSurprise
Q3 2021 -0.11 -0.08 +0.03 (-27%)
Q2 2021 -0.30 -0.12 +0.18 (-60%)
Q4 2020 -0.20 -0.21 -0.01 (+5%)
Q3 2020 -0.32 -0.75 -0.43 (+134%)
Q2 2020 -0.47 -0.44 +0.03 (-6%)
Q1 2020 -0.14 -0.48 -0.34 (+243%)
Q4 2019 0.30 0.35 +0.05 (+17%)
Q3 2019 0.20 0.21 +0.01 (+5%)
Q2 2019 0.28 0.32 +0.04 (+14%)
Q1 2019 0.19 0.18 -0.01 (-5%)
Q4 2018 0.24 0.26 +0.02 (+8%)
Q3 2018 0.11 0.14 +0.03 (+27%)
Q2 2018 0.26 0.30 +0.04 (+15%)
Q1 2018 0.10 0.21 +0.11 (+110%)
Q4 2017 0.32 0.34 +0.02 (+6%)
Q3 2017 0.03 0.08 +0.05 (+167%)
Q2 2017 0.22 0.15 -0.07 (-32%)
Q1 2017 0.09 0.06 -0.03 (-33%)
Q4 2016 0.25 0.22 -0.03 (-12%)
Q2 2016 0.23 0.18 -0.05 (-22%)
Q1 2016 0.15 0.22 +0.07 (+47%)
Q4 2015 0.45 0.39 -0.06 (-13%)
Q3 2015 0.20 0.17 -0.03 (-15%)
Q2 2015 0.37 0.40 +0.03 (+8%)
Q1 2015 0.04 0.07 +0.03 (+75%)
Q4 2014 0.30 0.34 +0.04 (+13%)
Q3 2014 0.10 0.11 +0.01 (+10%)
Q2 2014 0.21 0.27 +0.06 (+29%)
Q1 2014 0.07 0.01 -0.06 (-86%)
Q4 2013 0.33 0.44 +0.11 (+33%)
Q3 2013 0.05 0.06 +0.01 (+20%)
Q2 2013 0.26 0.17 -0.09 (-35%)
Q1 2013 0.09 0.08 -0.01 (-11%)
Q4 2012 0.16 0.23 +0.07 (+44%)
Q3 2012 0.21 0.26 +0.05 (+24%)
Q2 2012 0.22 0.21 -0.01 (-5%)
Imax Revenue Surprises Chart
PeriodExpectedActualSurprise
Q3 2021 57.03M 56.60M -0.43M (-1%)
Q2 2021 40.63M 50.95M +10.32M (+25%)
Q4 2020 46.81M 55.99M +9.18M (+20%)
Q3 2020 28.44M 37.26M +8.82M (+31%)
Q2 2020 11.85M 8.86M -3.00M (-25%)
Q1 2020 43.24M 34.90M -8.34M (-19%)
Q4 2019 117.99M 124.28M +6.29M (+5%)
Q3 2019 86.88M 86.39M -0.49M (-1%)
Q2 2019 98.43M 104.80M +6.37M (+6%)
Q1 2019 81.55M 80.20M -1.35M (-2%)
Q4 2018 102.38M 108.96M +6.58M (+6%)
Q3 2018 80.48M 82.11M +1.63M (+2%)
Q2 2018 98.84M 98.34M -0.49M (-1%)
Q1 2018 78.73M 84.98M +6.25M (+8%)
Q4 2017 121.46M 125.55M +4.09M (+3%)
Q3 2017 83.76M 98.80M +15.04M (+18%)
Q2 2017 95.32M 87.76M -7.56M (-8%)
Q1 2017 76.43M 68.66M -7.77M (-10%)
Q4 2016 101.04M 106.91M +5.87M (+6%)
Q2 2016 91.30M 91.74M +443000 (0%)
Q1 2016 83.76M 92.13M +8.37M (+10%)
Q4 2015 116.51M 119.33M +2.82M (+2%)
Q3 2015 79.49M 85.10M +5.61M (+7%)
Q2 2015 96.01M 107.16M +11.15M (+12%)
Q1 2015 54.09M 62.21M +8.12M (+15%)
Q4 2014 95.88M 102.46M +6.58M (+7%)
Q3 2014 60.67M 60.70M +30000 (0%)
Q2 2014 76.02M 79.14M +3.12M (+4%)
Q1 2014 50.82M 48.20M -2.62M (-5%)
Q4 2013 92.94M 105.10M +12.16M (+13%)
Q3 2013 51.78M 51.70M -80000 (-0%)
Q2 2013 76.36M 82.30M +5.94M (+8%)
Q1 2013 54.15M 49.90M -4.25M (-8%)
Q4 2012 73.74M 77.80M +4.06M (+6%)
Q3 2012 76.06M 80.70M +4.64M (+6%)
Q2 2012 71.64M 70.20M -1.44M (-2%)
Quotes delayed 20 minutes

Email EnvelopeFree IMAX Email Alerts:
Get Dividend Alerts
Get SEC Filing Alerts
10 Most Oversold S&P 500 Stocks
10 Most Overbought S&P 500 Stocks
10 ETFs With Stocks Insiders Are Buying
10 ETFs With Most Upside To Targets
The DividendRank Top 25
Warren Buffett Dividend Stocks
10 Cheap Dividend Stocks Under $10
10 Top DividendRank'ed Energy Stocks
The 10 Highest Yielding Preferred Stocks
The 15 Most Active S&P Call & Put Options

Next Earnings Date Calendar:

Buckle (BKE): 11/19/2021 6:50 AM
Foot Locker (FL): 11/19/2021 8:00 AM
Franklin Wireless (FKWL): 11/20/2021 9:13 AM
Zymergen (ZY): 11/22/2021 4:12 AM
Cerence (CRNC): 11/22/2021 7:00 AM
Spire (SR): 11/22/2021 7:00 AM
Avaya Hldgs (AVYA): 11/22/2021 7:00 AM
Twist Bioscience (TWST): 11/22/2021 8:00 AM
Energy Fuels (UUUU): 11/22/2021 8:54 AM
Procore Technologies (PCOR): 11/22/2021 9:04 AM

More from the Next Earnings Dates Calendar

Earnings History:

BellRing Brands (BRBR): 11/18/2021 5:00 PM
Post Holdings (POST): 11/18/2021 5:00 PM
Universal Security (UUU): 11/18/2021 After close
BioHiTech Global (BHTG): 11/18/2021 After close
Caleres (CAL): 11/18/2021 After close
ESCO Technologies (ESE): 11/18/2021 After close
UGI (UGI): 11/18/2021 After close
American Software (AMSWA): 11/18/2021 After close
Palo Alto Networks (PANW): 11/18/2021 After close
Globant (GLOB): 11/18/2021 After close

More from the Earnings History archive
On this page we presented the IMAX earnings surprises information for Imax, comparing the expected earnings versus the actual earnings quarter by quarter, with the resulting positive or negative percentage surprise. Any self directed investor doing their due diligence on IMAX (or any other given stock) can benefit from researching all of the Imax past earnings going backwards in time, including how often the company beat or missed the market's expectations. To help you with this Imax earnings surprise research, on this page we presented each quarter's resulting numbers for easy comparison. Studying these numbers can help an investor by providing important context with which to think about IMAX's next earnings report. In your continued research on Imax we hope you will be sure to check out the further links included for revenue and earnings history as well as next earnings dates for IMAX. Thanks for visiting, and the next time you need to research IMAX earnings surprises or those of another stock, we hope you'll think of our site as your go-to earnings surprises research resource of choice.
 

Imax Earnings Surprises | www.NextEarningsDate.com | Copyright © 2020 - 2021, All Rights Reserved

Nothing in NextEarningsDate.com is intended to be investment advice, nor does it represent the opinion of, counsel from, or recommendations by BNK Invest Inc. or any of its affiliates, subsidiaries or partners. None of the information contained herein constitutes a recommendation that any particular security, portfolio, transaction, or investment strategy is suitable for any specific person. All viewers agree that under no circumstances will BNK Invest, Inc,. its subsidiaries, partners, officers, employees, affiliates, or agents be held liable for any loss or damage caused by your reliance on information obtained. By visiting, using or viewing this site, you agree to the following Full Disclaimer & Terms of Use and Privacy Policy. Video widget and market videos powered by Market News Video. Quote and option data delayed at least 15 minutes; stock quote data powered by Ticker Technologies, and Mergent.