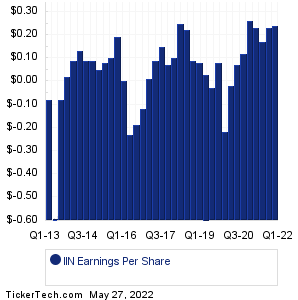
| IIN Earnings History | ||||||||||||||||||||||||||||||||||||||||||||||||||||||||||||||||||||||||||||||||||||||||||||||||||||||||||||||||||
|
|
|
| IIN Earnings History | ||||||||||||||||||||||||||||||||||||||||||||||||||||||||||||||||||||||||||||||||||||||||||||||||||||||||||||||||||
|
|
|
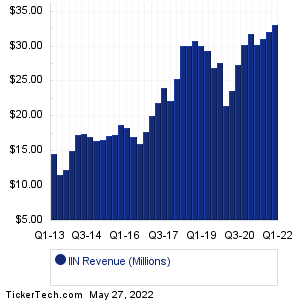
| IIN Revenue History | ||||||||||||||||||||||||||||||||||||||||||||||||||||||||||||||||||||||||||||||||||||||||||||||||||||||||||||||||||
|
| IIN Current Stock Quote |
Get Dividend Alerts Get SEC Filing Alerts |
| IIN Stock Price Chart |
| Next Earnings Dates |
Next Earnings Date Calendar:Big Lots (BIG): 5/27/2022 6:00 AMGemini Therapeutics (GMTX): 5/27/2022 6:00 AM Lixte Biotech Holdings (LIXT): 5/27/2022 6:00 AM Hibbett Sports (HIBB): 5/27/2022 6:30 AM Citrix Systems (CTXS): 5/27/2022 7:00 AM TG Therapeutics (TGTX): 5/27/2022 7:00 AM ImmunityBio (IBRX): 5/27/2022 7:00 AM Sonnet BioTherapeutics (SONN): 5/27/2022 7:00 AM Foghorn Therapeutics (FHTX): 5/27/2022 8:00 AM Gatos Silver (GATO): 5/27/2022 8:00 AM More from the Next Earnings Dates Calendar Earnings History:Dell Technologies (DELL): 5/26/2022 After closeAmerican Eagle Outfitters (AEO): 5/26/2022 After close Gap (GPS): 5/26/2022 After close Costco Wholesale (COST): 5/26/2022 After close Boot Barn Holdings (BOOT): 5/26/2022 After close Red Robin Gourmet Burgers (RRGB): 5/26/2022 After close 23andMe Holding (ME): 5/26/2022 After close Lions Gate Entertainment Corporation Class A Voting Shares (LGF-A): 5/26/2022 After close Domo (DOMO): 5/26/2022 After close StepStone Group (STEP): 5/26/2022 After close More from the Earnings History archive |
| Featured Articles |
| Earnings Peers |
| IntriCon (IIN) is categorized under the Healthcare sector; to help you further research past earnings across stocks, below are some other companies in the same sector:
IKNA Historical Earnings IKT Historical Earnings ILMN Historical Earnings IMAC Historical Earnings IMGN Historical Earnings IMGO Historical Earnings IMNM Historical Earnings IMPL Historical Earnings IMRA Historical Earnings IMRX Historical Earnings |
Recommended: GAU Videos, IPV market cap history, EGT Historical Stock Prices.