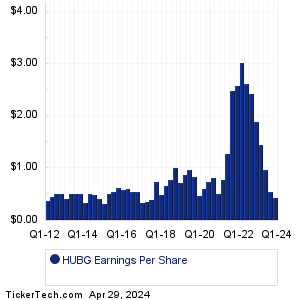
| HUBG Earnings History | |||||||||||||||||||||||||||||||||||||||||||||||||||||||||||||||||||||||||||||||||||||||||||||||||||||||||||||||||||||||||||||||||||||||||||||||||||
|
|
|
| HUBG Earnings History | |||||||||||||||||||||||||||||||||||||||||||||||||||||||||||||||||||||||||||||||||||||||||||||||||||||||||||||||||||||||||||||||||||||||||||||||||||
|
|
|
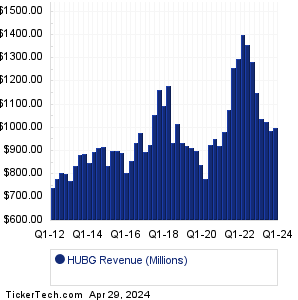
| HUBG Revenue History | |||||||||||||||||||||||||||||||||||||||||||||||||||||||||||||||||||||||||||||||||||||||||||||||||||||||||||||||||||||||||||||||||||||||||||||||||||
|
| HUBG Current Stock Quote |
Get Dividend Alerts Get SEC Filing Alerts |
| HUBG Stock Price Chart |
| Next Earnings Dates |
Next Earnings Date Calendar:BlackRock (BLK): 4/12/2024 6:00 AMWells Fargo (WFC): 4/12/2024 6:45 AM JPMorgan Chase (JPM): 4/12/2024 7:00 AM OncoCyte (OCX): 4/12/2024 7:00 AM Coeptis Therapeutics (COEP): 4/12/2024 7:00 AM State Street (STT): 4/12/2024 7:30 AM Citigroup (C): 4/12/2024 8:00 AM Bank7 (BSVN): 4/12/2024 8:01 AM Progressive (PGR): 4/12/2024 8:21 AM Hycroft Mining Holding (HYMC): 4/12/2024 After close More from the Next Earnings Dates Calendar Earnings History:Applied Digital (APLD): 4/11/2024 After closeArgan (AGX): 4/11/2024 After close US Energy (USEG): 4/11/2024 After close National CineMedia (NCMI): 4/11/2024 After close Kore Group Holdings (KORE): 4/11/2024 8:00 AM Northern Technologies (NTIC): 4/11/2024 8:00 AM Constellation Brands (STZ): 4/11/2024 7:30 AM Lovesac (LOVE): 4/11/2024 7:00 AM CarMax (KMX): 4/11/2024 6:50 AM Fastenal (FAST): 4/11/2024 6:50 AM More from the Earnings History archive |
| Featured Articles |
| Earnings Peers |
| Hub Group (HUBG) is categorized under the Industrials sector; to help you further research past earnings across stocks, below are some other companies in the same sector:
HURC Past Earnings HURN Past Earnings HWCC Past Earnings IBP Past Earnings ICFI Past Earnings IEA Past Earnings IEC Past Earnings IESC Past Earnings IEX Past Earnings IHS Past Earnings |
Recommended: XBIO Historical Stock Prices, NXGL Stock Predictions, SLG Options Chain.
Click the button below for your complimentary copy of Your Early Retirement Portfolio: Dividends Up to 8.7%—Every Month—Forever.
You'll discover the details on 4 stocks and funds that pay you massive dividends as high as 8.7%.