HRC Earnings Surprises image   This HRC earnings surprises page last updated 11/8/2021
HRC Earnings Surprises Chart
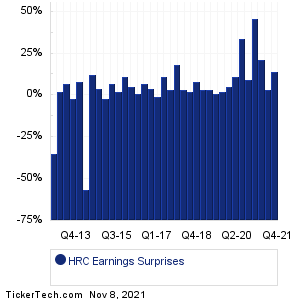
Data adjusted for HRC split history

PeriodExpectedActualSurprise
Q4 2021 1.47 1.67 +0.20 (+14%)
Q3 2021 1.34 1.38 +0.04 (+3%)
Q2 2021 1.43 1.73 +0.30 (+21%)
Q1 2021 1.05 1.53 +0.48 (+46%)
Q4 2020 1.07 1.17 +0.10 (+9%)
Q3 2020 1.46 1.95 +0.49 (+34%)
Q2 2020 1.15 1.28 +0.13 (+11%)
Q1 2020 1.08 1.13 +0.05 (+5%)
Q4 2019 1.65 1.69 +0.04 (+2%)
Q3 2019 1.22 1.23 +0.01 (+1%)
Q2 2019 1.11 1.14 +0.03 (+3%)
Q1 2019 0.99 1.02 +0.03 (+3%)
Q4 2018 1.51 1.63 +0.12 (+8%)
Q3 2018 1.13 1.15 +0.02 (+2%)
Q2 2018 1.02 1.05 +0.03 (+3%)
Q1 2018 0.78 0.92 +0.14 (+18%)
Q4 2017 1.28 1.32 +0.04 (+3%)
Q2 2017 0.79 0.88 +0.09 (+11%)
Q1 2017 0.76 0.75 -0.01 (-1%)
Q4 2016 1.13 1.18 +0.05 (+4%)
Q3 2016 0.76 0.81 +0.05 (+7%)
Q2 2016 0.70 0.71 +0.01 (+1%)
Q1 2016 0.65 0.68 +0.03 (+5%)
Q4 2015 0.80 0.89 +0.09 (+11%)
Q3 2015 0.61 0.62 +0.01 (+2%)
Q2 2015 0.60 0.64 +0.04 (+7%)
Q1 2015 0.50 0.49 -0.01 (-2%)
Q4 2014 0.71 0.74 +0.03 (+4%)
Q2 2014 0.51 0.57 +0.06 (+12%)
Q1 2014 0.51 0.22 -0.29 (-57%)
Q4 2013 0.60 0.65 +0.05 (+8%)
Q2 2013 0.50 0.49 -0.01 (-2%)
Q1 2013 0.44 0.47 +0.03 (+7%)
Q4 2012 0.55 0.56 +0.01 (+2%)
Q3 2012 0.57 0.37 -0.20 (-35%)
HRC Revenue Surprises Chart
PeriodExpectedActualSurprise
Q4 2021 752.93M 797.90M +44.97M (+6%)
Q3 2021 708.33M 717.70M +9.37M (+1%)
Q2 2021 732.20M 762.00M +29.80M (+4%)
Q1 2021 654.41M 741.10M +86.69M (+13%)
Q4 2020 696.36M 705.30M +8.94M (+1%)
Q3 2020 749.39M 767.50M +18.11M (+2%)
Q2 2020 701.64M 723.20M +21.56M (+3%)
Q1 2020 684.01M 685.00M +990000 (0%)
Q4 2019 760.14M 782.80M +22.66M (+3%)
Q3 2019 718.20M 726.80M +8.60M (+1%)
Q2 2019 706.38M 714.20M +7.82M (+1%)
Q1 2019 676.38M 683.50M +7.12M (+1%)
Q4 2018 750.90M 759.20M +8.30M (+1%)
Q3 2018 707.50M 708.60M +1.10M (0%)
Q2 2018 705.51M 710.50M +4.99M (+1%)
Q1 2018 656.46M 669.70M +13.24M (+2%)
Q4 2017 731.93M 738.30M +6.37M (+1%)
Q2 2017 653.06M 678.90M +25.84M (+4%)
Q1 2017 656.82M 637.40M -19.42M (-3%)
Q4 2016 701.39M 706.00M +4.61M (+1%)
Q3 2016 646.61M 655.40M +8.79M (+1%)
Q2 2016 651.80M 632.60M -19.20M (-3%)
Q1 2016 659.52M 661.20M +1.68M (0%)
Q4 2015 551.11M 573.90M +22.79M (+4%)
Q3 2015 447.54M 474.50M +26.96M (+6%)
Q2 2015 471.78M 474.80M +3.02M (+1%)
Q1 2015 456.87M 465.00M +8.13M (+2%)
Q4 2014 467.50M 480.00M +12.50M (+3%)
Q2 2014 412.02M 415.00M +2.98M (+1%)
Q1 2014 406.04M 393.40M -12.64M (-3%)
Q4 2013 438.78M 437.90M -0.88M (-0%)
Q2 2013 436.27M 425.70M -10.57M (-2%)
Q1 2013 414.20M 428.00M +13.80M (+3%)
Q4 2012 418.07M 432.00M +13.93M (+3%)
Q3 2012 423.41M 406.00M -17.41M (-4%)
Quotes delayed 20 minutes

Email EnvelopeFree HRC Email Alerts:
Get Dividend Alerts
Get SEC Filing Alerts
10 Most Oversold S&P 500 Stocks
10 Most Overbought S&P 500 Stocks
10 ETFs With Stocks Insiders Are Buying
10 ETFs With Most Upside To Targets
The DividendRank Top 25
Warren Buffett Dividend Stocks
10 Cheap Dividend Stocks Under $10
10 Top DividendRank'ed Energy Stocks
The 10 Highest Yielding Preferred Stocks
The 15 Most Active S&P Call & Put Options

Next Earnings Date Calendar:

Coty (COTY): 11/8/2021 6:00 AM
RadNet (RDNT): 11/8/2021 6:00 AM
Astronics (ATRO): 11/8/2021 6:30 AM
Matinas BioPharma Hldgs (MTNB): 11/8/2021 6:30 AM
Tyme Technologies (TYME): 11/8/2021 6:45 AM
Tyme Technologies (USFD): 11/8/2021 6:50 AM
Treehouse Foods (THS): 11/8/2021 6:55 AM
Viatris (VTRS): 11/8/2021 7:00 AM
Black Knight (BKI): 11/8/2021 7:00 AM
Editas Medicine (EDIT): 11/8/2021 7:00 AM

More from the Next Earnings Dates Calendar

Earnings History:

Berkshire Hathaway Inc. Common Stock (BRK-A): 11/6/2021 7:00 AM
Berkshire Hathaway Inc. New Common Stock (BRK-B): 11/6/2021 7:00 AM
NI Holdings (NODK): 11/5/2021 After close
Ocwen Financial (OCN): 11/5/2021 After close
Zedge (ZDGE): 11/5/2021 After close
HV Bancorp (HVBC): 11/5/2021 After close
Ames National (ATLO): 11/5/2021 After close
Pinnacle West Capital (PNW): 11/5/2021 8:40 AM
Hudson Global (HSON): 11/5/2021 8:30 AM
MFA Financial (MFA): 11/5/2021 8:30 AM

More from the Earnings History archive
Hill-Rom Holdings (HRC) is categorized under the Healthcare sector; to help you further research past earnings across stocks, below are some other companies in the same sector:

HRMY Past Earnings
HROW Past Earnings
HRTX Past Earnings
HSDT Past Earnings
HSIC Past Earnings
HSKA Past Earnings
HSTO Past Earnings
HTBX Past Earnings
HTGM Past Earnings
HZNP Past Earnings
On this page we presented the HRC earnings surprises information for Hill-Rom Holdings, comparing the expected earnings versus the actual earnings quarter by quarter, with the resulting positive or negative percentage surprise. Any self directed investor doing their due diligence on HRC (or any other given stock) can benefit from researching all of the Hill-Rom Holdings past earnings going backwards in time, including how often the company beat or missed the market's expectations. To help you with this Hill-Rom Holdings earnings surprise research, on this page we presented each quarter's resulting numbers for easy comparison. Studying these numbers can help an investor by providing important context with which to think about HRC's next earnings report. In your continued research on Hill-Rom Holdings we hope you will be sure to check out the further links included for revenue and earnings history as well as next earnings dates for HRC. Thanks for visiting, and the next time you need to research HRC earnings surprises or those of another stock, we hope you'll think of our site as your go-to earnings surprises research resource of choice.
 

HRC Earnings Surprises | www.NextEarningsDate.com | Copyright © 2020 - 2021, All Rights Reserved

Nothing in NextEarningsDate.com is intended to be investment advice, nor does it represent the opinion of, counsel from, or recommendations by BNK Invest Inc. or any of its affiliates, subsidiaries or partners. None of the information contained herein constitutes a recommendation that any particular security, portfolio, transaction, or investment strategy is suitable for any specific person. All viewers agree that under no circumstances will BNK Invest, Inc,. its subsidiaries, partners, officers, employees, affiliates, or agents be held liable for any loss or damage caused by your reliance on information obtained. By visiting, using or viewing this site, you agree to the following Full Disclaimer & Terms of Use and Privacy Policy. Video widget and market videos powered by Market News Video. Quote and option data delayed at least 15 minutes; stock quote data powered by Ticker Technologies, and Mergent.