HollyFrontier Earnings Surprises image   This HFC earnings surprises page last updated 2/25/2022
HollyFrontier Earnings Surprises Chart
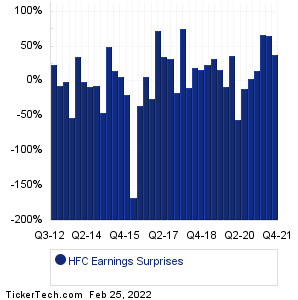
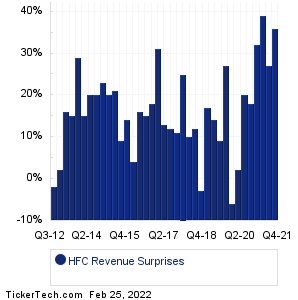
Data adjusted for HFC split history

PeriodExpectedActualSurprise
Q4 2021 -0.08 -0.11 -0.03 (+38%)
Q3 2021 0.77 1.28 +0.51 (+66%)
Q2 2021 0.52 0.87 +0.35 (+67%)
Q1 2021 -0.46 -0.53 -0.07 (+15%)
Q4 2020 -0.71 -0.74 -0.03 (+4%)
Q3 2020 -0.46 -0.41 +0.05 (-11%)
Q2 2020 -0.55 -0.25 +0.30 (-55%)
Q1 2020 0.39 0.53 +0.14 (+36%)
Q4 2019 0.52 0.48 -0.04 (-8%)
Q3 2019 1.43 1.68 +0.25 (+17%)
Q2 2019 1.64 2.18 +0.54 (+33%)
Q1 2019 0.44 0.54 +0.10 (+23%)
Q4 2018 1.93 2.25 +0.32 (+17%)
Q3 2018 1.67 1.98 +0.31 (+19%)
Q2 2018 1.61 1.45 -0.16 (-10%)
Q1 2018 0.44 0.77 +0.33 (+75%)
Q4 2017 0.83 0.70 -0.13 (-16%)
Q3 2017 0.86 1.14 +0.28 (+33%)
Q2 2017 0.49 0.66 +0.17 (+35%)
Q1 2017 -0.11 -0.19 -0.08 (+73%)
Q4 2016 -0.08 -0.06 +0.02 (-25%)
Q3 2016 0.36 0.38 +0.02 (+6%)
Q2 2016 0.43 0.28 -0.15 (-35%)
Q1 2016 0.09 -0.06 -0.15 (-167%)
Q4 2015 0.30 0.24 -0.06 (-20%)
Q3 2015 1.72 1.82 +0.10 (+6%)
Q2 2015 1.26 1.45 +0.19 (+15%)
Q1 2015 0.78 1.16 +0.38 (+49%)
Q4 2014 0.22 0.12 -0.10 (-45%)
Q3 2014 0.95 0.88 -0.07 (-7%)
Q2 2014 0.97 0.89 -0.08 (-8%)
Q1 2014 0.77 0.76 -0.01 (-1%)
Q4 2013 0.23 0.31 +0.08 (+35%)
Q3 2013 0.86 0.41 -0.45 (-52%)
Q2 2013 1.41 1.40 -0.01 (-1%)
Q1 2013 1.73 1.63 -0.10 (-6%)
Q3 2012 2.40 2.94 +0.54 (+23%)
HollyFrontier Revenue Surprises Chart
PeriodExpectedActualSurprise
Q4 2021 4.13B 5.62B +1.49B (+36%)
Q3 2021 3.68B 4.68B +1.00B (+27%)
Q2 2021 3.29B 4.58B +1.29B (+39%)
Q1 2021 2.65B 3.50B +854.00M (+32%)
Q4 2020 2.46B 2.90B +441.00M (+18%)
Q3 2020 2.35B 2.82B +469.40M (+20%)
Q2 2020 2.03B 2.06B +33.00M (+1%)
Q1 2020 3.63B 3.40B -0.23B (-6%)
Q4 2019 3.44B 4.38B +942.00M (+27%)
Q3 2019 4.07B 4.42B +355.00M (+9%)
Q2 2019 4.20B 4.78B +583.00M (+14%)
Q1 2019 3.33B 3.90B +567.00M (+17%)
Q4 2018 4.49B 4.34B -0.15B (-3%)
Q3 2018 4.25B 4.77B +521.00M (+12%)
Q2 2018 4.07B 4.47B +401.00M (+10%)
Q1 2018 3.31B 4.13B +818.00M (+25%)
Q4 2017 3.59B 3.99B +403.00M (+11%)
Q3 2017 3.33B 3.72B +389.00M (+12%)
Q2 2017 3.06B 3.46B +399.00M (+13%)
Q1 2017 2.35B 3.08B +730.00M (+31%)
Q4 2016 2.50B 2.96B +455.00M (+18%)
Q3 2016 2.47B 2.85B +377.00M (+15%)
Q2 2016 2.35B 2.71B +365.00M (+15%)
Q1 2016 1.94B 2.02B +79.00M (+4%)
Q4 2015 2.59B 2.94B +354.00M (+14%)
Q3 2015 3.30B 3.59B +286.00M (+9%)
Q2 2015 3.07B 3.70B +632.00M (+21%)
Q1 2015 2.50B 3.01B +507.00M (+20%)
Q4 2014 3.47B 4.28B +813.00M (+23%)
Q3 2014 4.45B 5.32B +870.00M (+20%)
Q2 2014 4.46B 5.37B +910.00M (+20%)
Q1 2014 4.18B 4.79B +611.00M (+15%)
Q4 2013 3.73B 4.83B +1.10B (+29%)
Q3 2013 4.62B 5.33B +710.00M (+15%)
Q2 2013 4.55B 5.30B +748.00M (+16%)
Q1 2013 4.59B 4.70B +110.00M (+2%)
Q3 2012 5.30B 5.21B -95.00M (-2%)
Quotes delayed 20 minutes

Email EnvelopeFree HFC Email Alerts:
Get Dividend Alerts
Get SEC Filing Alerts
10 Most Oversold S&P 500 Stocks
10 Most Overbought S&P 500 Stocks
10 ETFs With Stocks Insiders Are Buying
10 ETFs With Most Upside To Targets
The DividendRank Top 25
Warren Buffett Dividend Stocks
10 Cheap Dividend Stocks Under $10
10 Top DividendRank'ed Energy Stocks
The 10 Highest Yielding Preferred Stocks
The 15 Most Active S&P Call & Put Options

Next Earnings Date Calendar:

Evergy (EVRG): 2/25/2022 6:00 AM
Lamar Advertising (LAMR): 2/25/2022 6:00 AM
ModivCare (MODV): 2/25/2022 6:00 AM
Northwest Natural Holding (NWN): 2/25/2022 6:00 AM
City Office REIT (CIO): 2/25/2022 6:00 AM
US Silica Holdings (SLCA): 2/25/2022 6:00 AM
Ecovyst (ECVT): 2/25/2022 6:15 AM
Carter's (CRI): 2/25/2022 6:23 AM
Vistra Energy (VST): 2/25/2022 6:30 AM
Cinemark Hldgs (CNK): 2/25/2022 6:30 AM

More from the Next Earnings Dates Calendar

Earnings History:

MoneyGram Int (MGI): 2/24/2022 7:30 PM
Ryman Hospitality (RHP): 2/24/2022 6:34 PM
ESS Tech (GWH): 2/24/2022 6:00 PM
AES (AES): 2/24/2022 6:00 PM
Talos Energy (TALO): 2/24/2022 5:30 PM
Ovintiv (OVV): 2/24/2022 5:30 PM
Oceaneering International (OII): 2/24/2022 5:01 PM
Ashford Inc. Common Stock (AINC): 2/24/2022 After close
Granite Point Mortgage (GPMT): 2/24/2022 After close
Select Medical Holdings (SEM): 2/24/2022 After close

More from the Earnings History archive
HollyFrontier (HFC) is categorized under the Energy sector; to help you further research past earnings across stocks, below are some other companies in the same sector:

HLX Past Earnings
HP Past Earnings
ICD Past Earnings
INT Past Earnings
IO Past Earnings
KLXE Past Earnings
KMI Past Earnings
KOS Past Earnings
LBRT Past Earnings
LPI Past Earnings
On this page we presented the HFC earnings surprises information for HollyFrontier, comparing the expected earnings versus the actual earnings quarter by quarter, with the resulting positive or negative percentage surprise. Any self directed investor doing their due diligence on HFC (or any other given stock) can benefit from researching all of the HollyFrontier past earnings going backwards in time, including how often the company beat or missed the market's expectations. To help you with this HollyFrontier earnings surprise research, on this page we presented each quarter's resulting numbers for easy comparison. Studying these numbers can help an investor by providing important context with which to think about HFC's next earnings report. In your continued research on HollyFrontier we hope you will be sure to check out the further links included for revenue and earnings history as well as next earnings dates for HFC. Thanks for visiting, and the next time you need to research HFC earnings surprises or those of another stock, we hope you'll think of our site as your go-to earnings surprises research resource of choice.

Recommended: Funds Holding RS, DIN Stock Predictions, ETFs Holding TRUE.


HollyFrontier Earnings Surprises | www.NextEarningsDate.com | Copyright © 2020 - 2022, All Rights Reserved

Nothing in NextEarningsDate.com is intended to be investment advice, nor does it represent the opinion of, counsel from, or recommendations by BNK Invest Inc. or any of its affiliates, subsidiaries or partners. None of the information contained herein constitutes a recommendation that any particular security, portfolio, transaction, or investment strategy is suitable for any specific person. All viewers agree that under no circumstances will BNK Invest, Inc,. its subsidiaries, partners, officers, employees, affiliates, or agents be held liable for any loss or damage caused by your reliance on information obtained. By visiting, using or viewing this site, you agree to the following Full Disclaimer & Terms of Use and Privacy Policy. Video widget and market videos powered by Market News Video. Quote and option data delayed at least 15 minutes; stock quote data powered by Ticker Technologies, and Mergent.